Rules to Better DevOps
Do you know what the goal of DevOps is?
The goal of DevOps is to improve collaboration and communication between software development and IT operations teams, in order to deliver high-quality software products quickly and efficiently.
DevOps aims to automate the software development and delivery process, by implementing practices such as continuous integration, continuous delivery, and continuous deployment. This helps to reduce the time it takes to develop and release software, while also improving the quality and reliability of the final product.
You should know what's going on with your errors and usage.The goal should be:
A client calls and says: "I'm having problems with your software."
Your answer: "Yes I know. Each morning we check the health of the app and we already saw a new exception. So I already have an engineer working on it."
Take this survey to find out your DevOps index.
DevOps – Stage 1: Do you know what things to measure?
Before you begin your journey into DevOps, you should assess yourself and see where your project is at and where you can improve.
For any software team, understanding your current DevOps maturity is essential to delivering high-quality products faster and more reliably. By measuring the right areas, teams can pinpoint strengths, uncover gaps, and create a clear roadmap for improvement.
Access your team's DevOps maturity
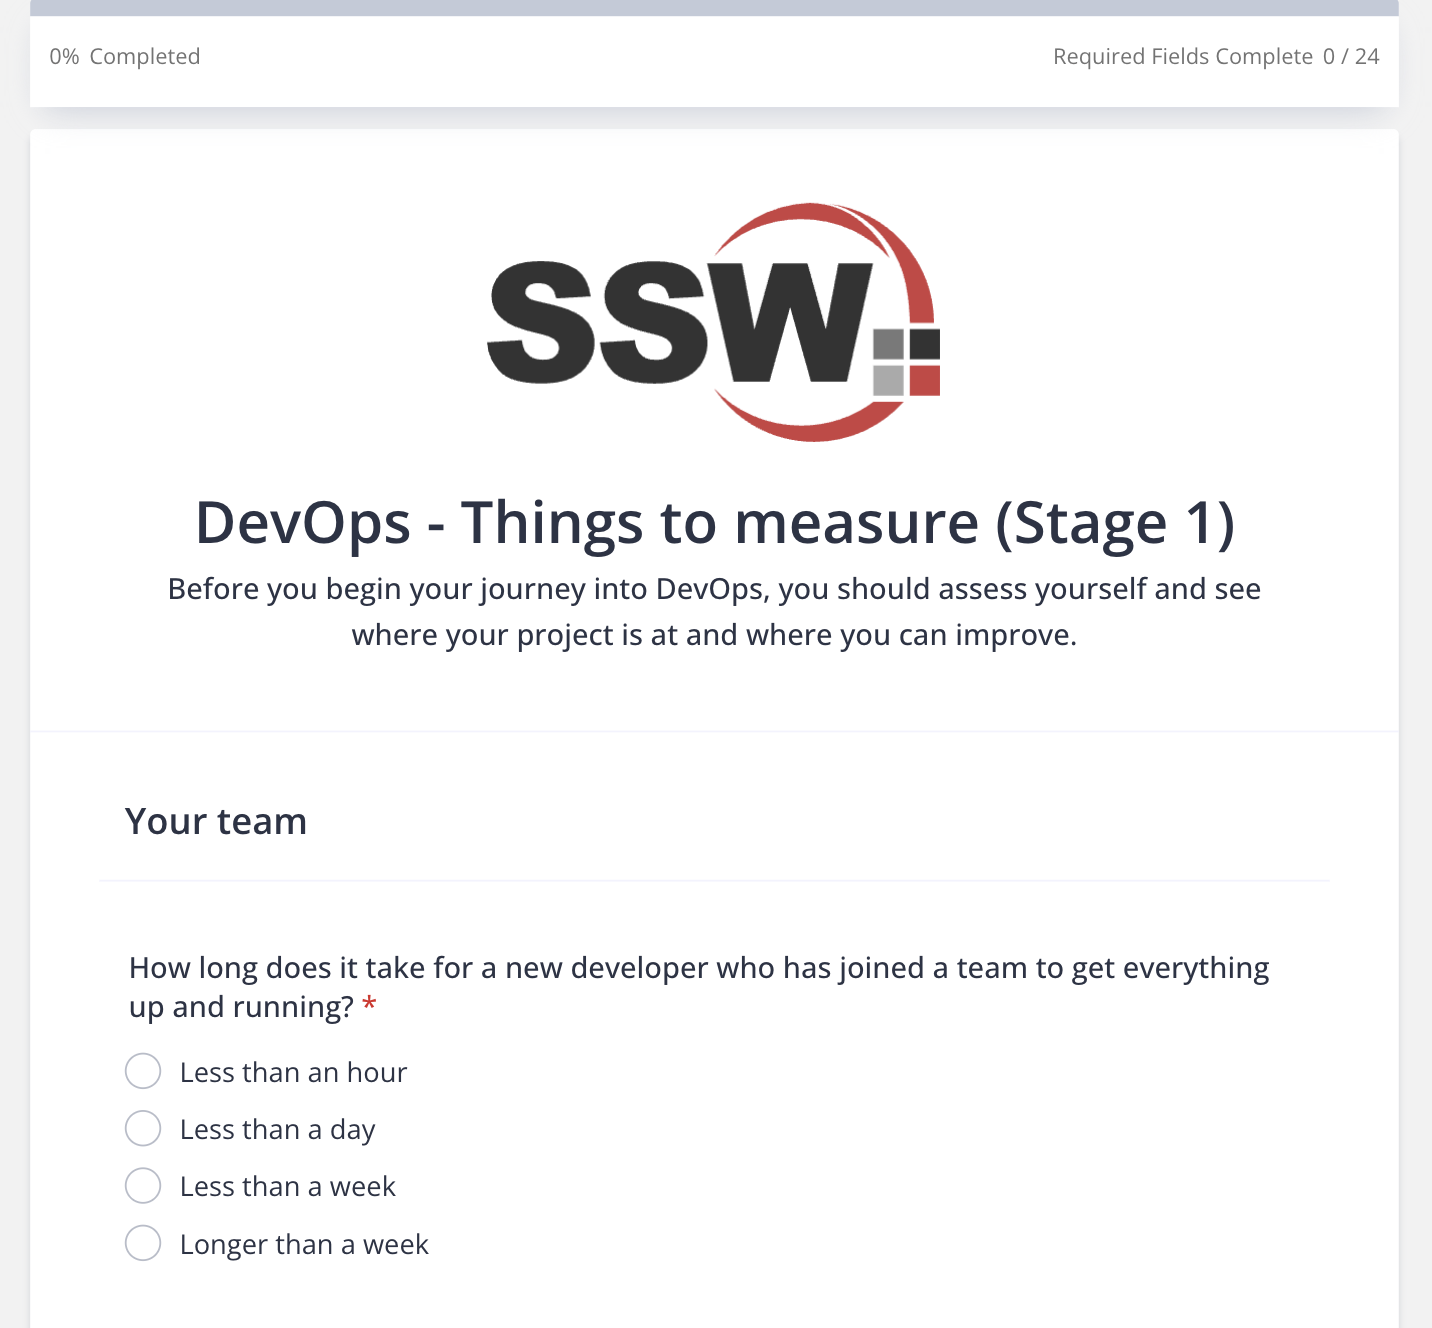
Figure: Fill the form to find out your DevOps index
This comprehensive DevOps evaluation covers these critical domains:
1. Team Onboarding & Collaboration
Efficient onboarding and seamless collaboration set the foundation for high-performing teams. Key aspects to track include onboarding time for new members, quality of documentation, communication tools in use, team size, meeting cadence, and the presence of cross-functional skills.
2. Deployments
Deployment practices are a strong indicator of delivery capability. Teams should monitor their most recent deployment date, deployment frequency, downtime during releases, incident resolution times, the number of environments, and overall deployment cycle time.
3. Coding Practices
High-quality code starts with disciplined development habits. This includes the use of source control, effective branching strategies, peer code reviews, well-defined pull-request workflows, and regular updates of dependencies.
4. Development Process
A clear and consistent process helps teams deliver predictably. Evaluate the development methodology in use—whether Agile, Scrum, Kanban, or hybrid—and how well the team identifies and manages technical debt.
5. Automation
Automation reduces manual effort and minimizes errors. Track automation in infrastructure provisioning, build pipelines, deployment workflows, and UI testing to ensure repeatable, scalable delivery.
6. Telemetry
Continuous monitoring is essential for proactive improvement. Measure how effectively your team tracks errors, monitors performance, and analyzes usage to inform both technical and business decisions.
By assessing these through a Software Audit, teams will gain a detailed picture of their DevOps maturity, allowing them to take targeted actions that lead to faster releases, fewer issues, and better collaboration across the board.
DevOps – Stage 2: Do you know what things to automate?
Once you’ve identified the manual processes in Stage 1, you can start looking at automation. The two best tools for build and release automation are Github and Azure DevOps.
See Rules to Better Continuous Deployments with TFS.
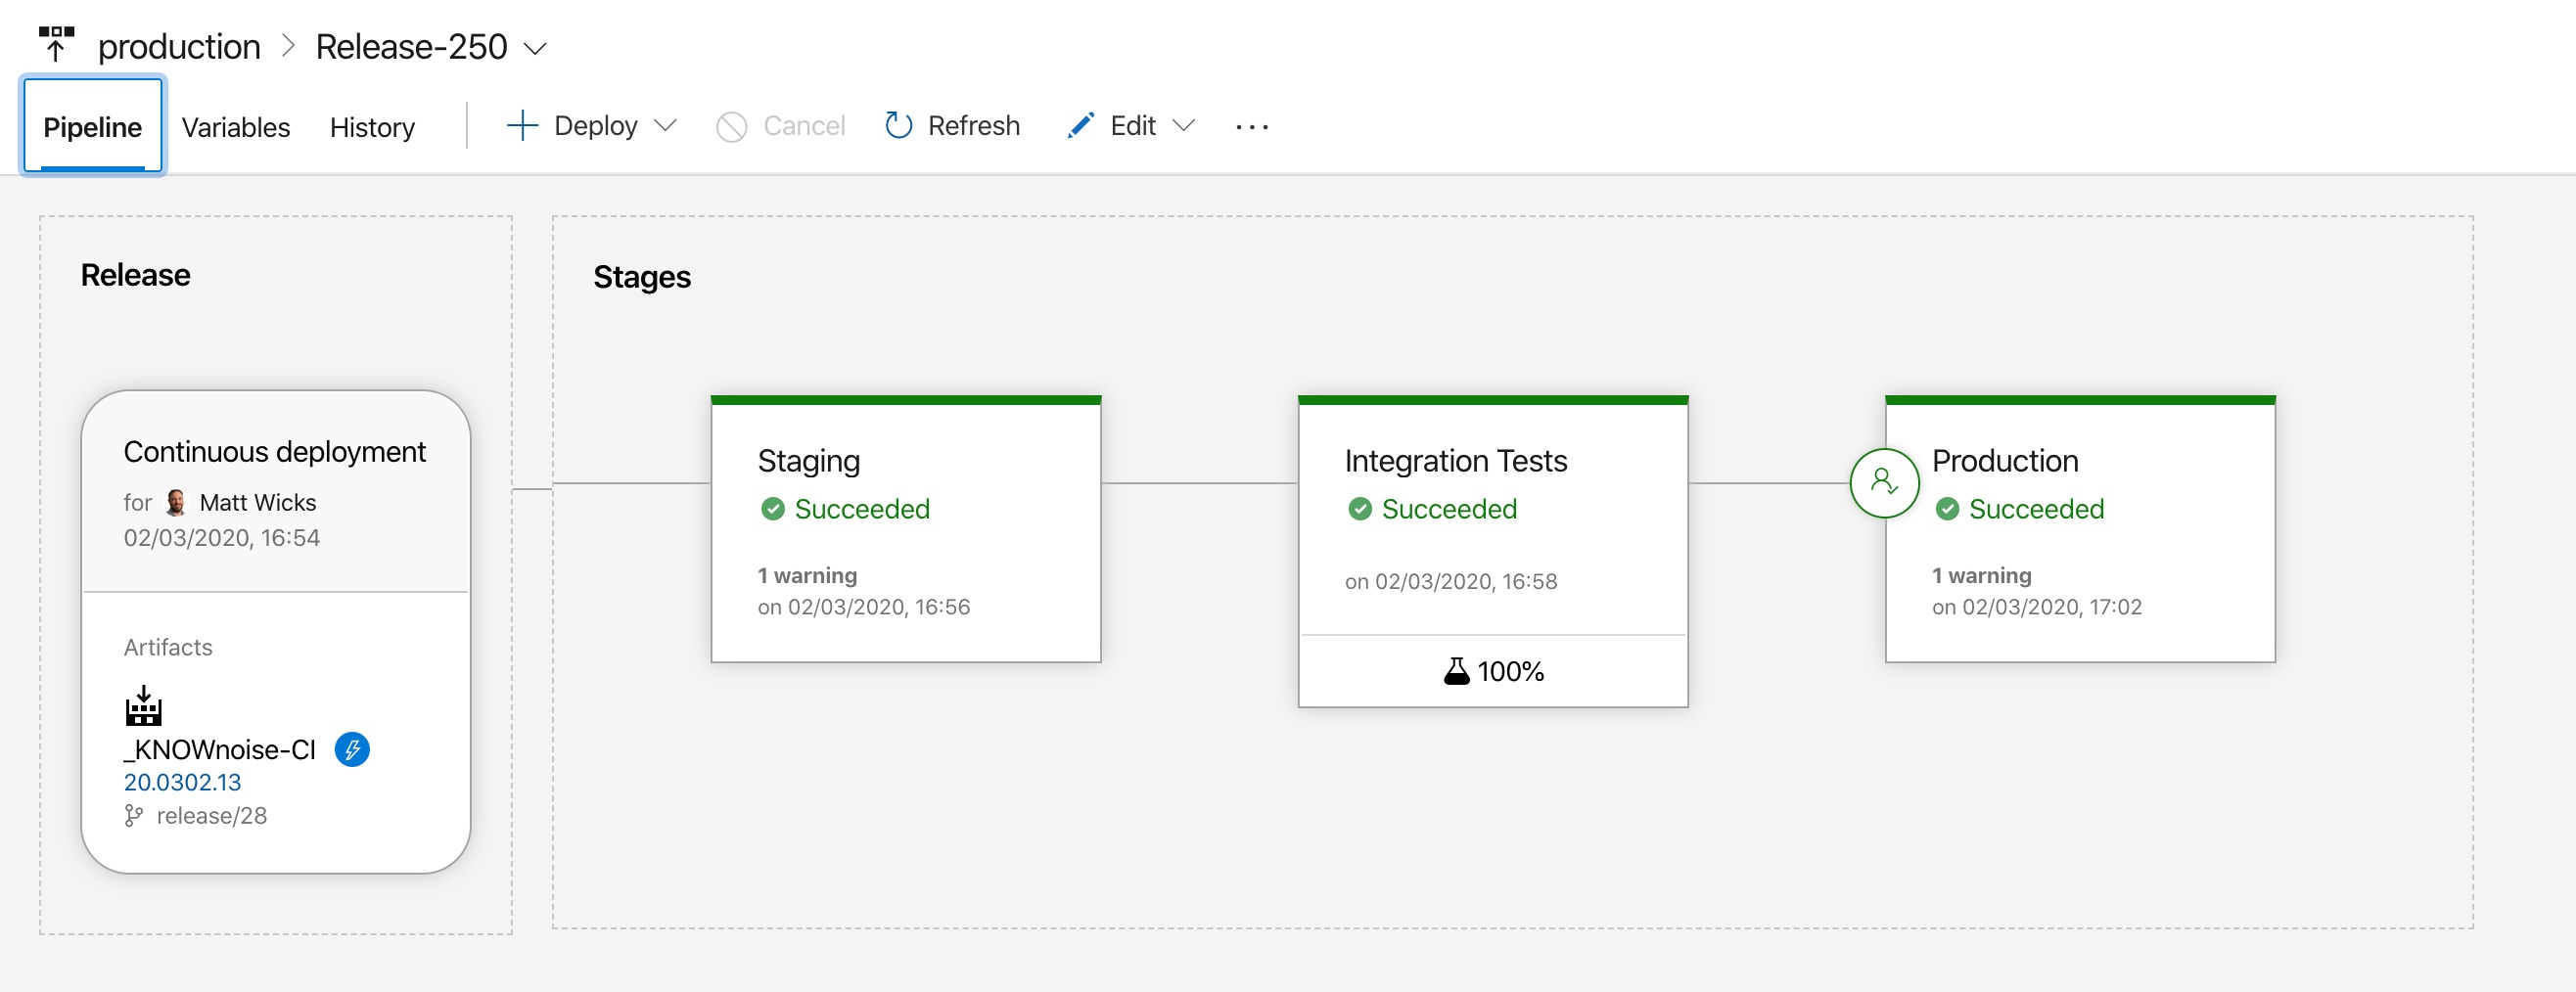
Figure: In Azure DevOps you can automate application deployment to a staging environment and automatically run tests before deploying to production
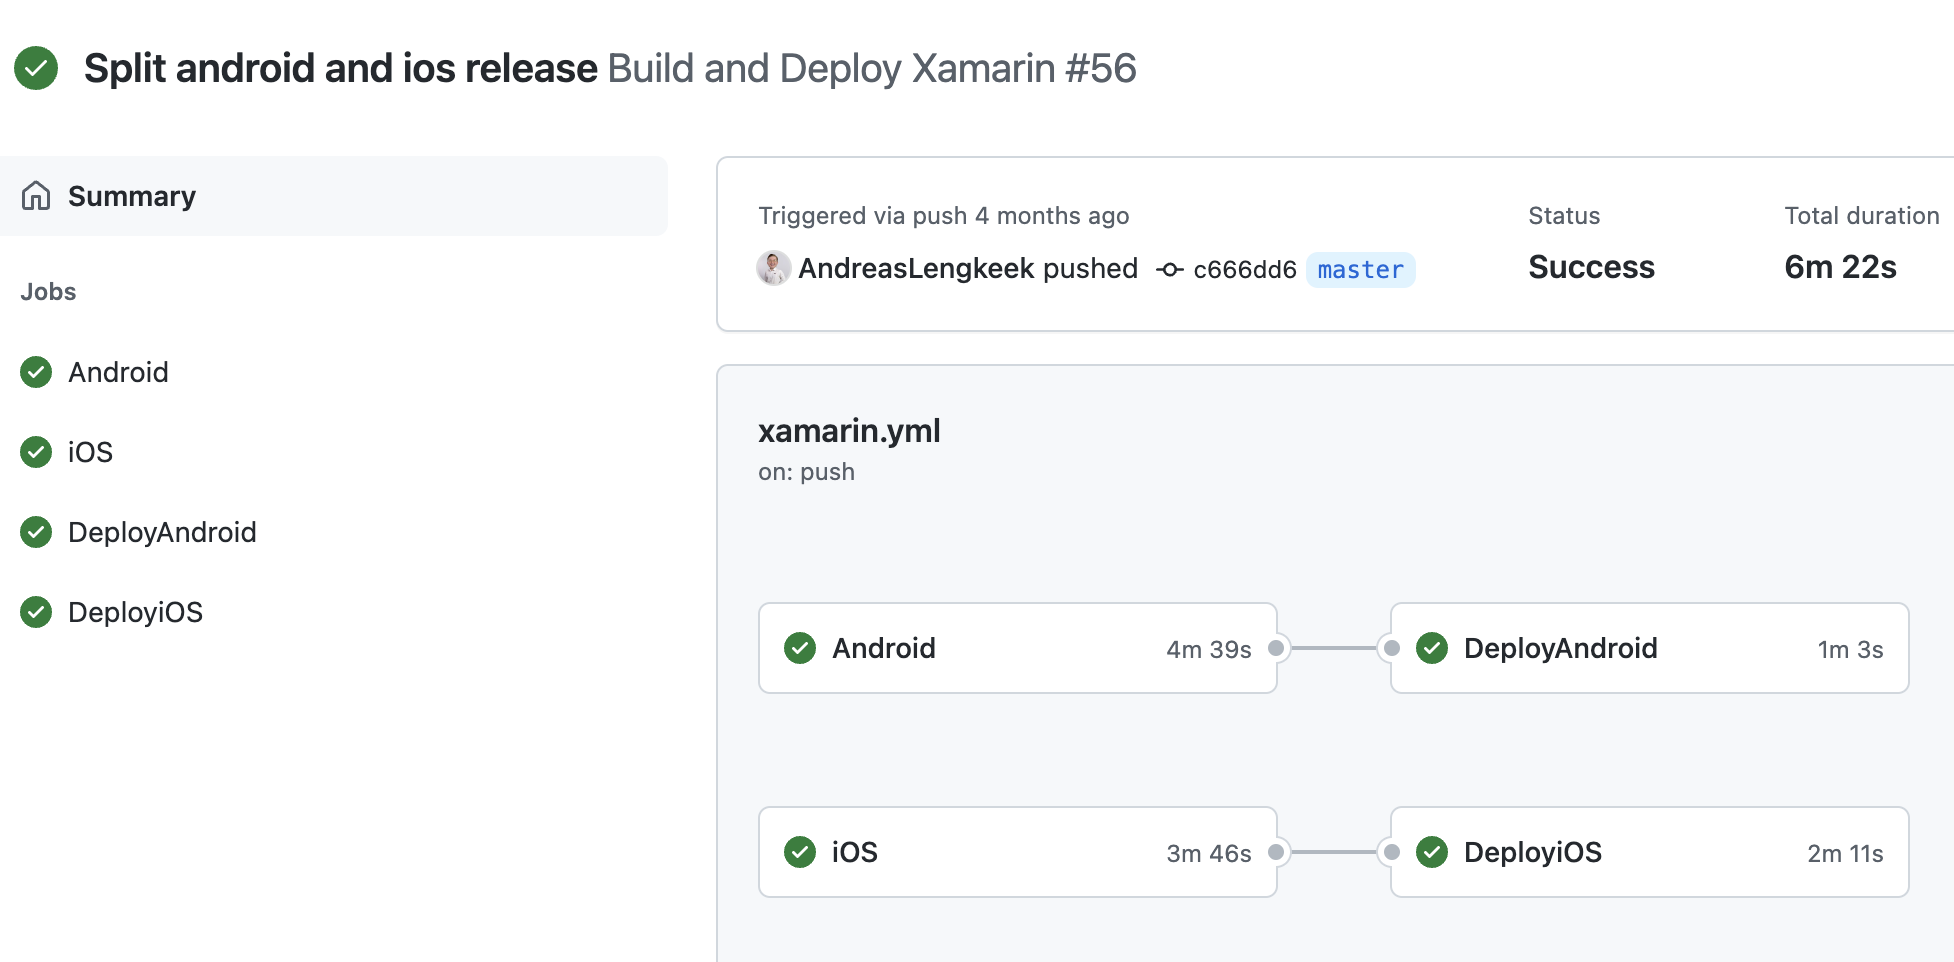
Figure: In GitHub actions you can automate application deployment to a multiple environments and automatically run tests before deploying to production
DevOps – Stage 3: Do you know what metrics to collect?
Now that your team is spending less time deploying the application, you’ve got more time to improve other aspects of the application, but first you need to know what to improve.
Here are a few easy things to gather metrics on:
Application Logging (Exceptions)
See how many errors are being produced, aim to reduce this as the produce matures:
- Application Insights
- RayGun.io
- Visual Studio App Center(for mobile)
But it's not only exceptions you should be looking at but also how your users are using the application, so you can see where you should invest your time:
- Google Analytics
- RayGun.io (Pulse)
Application Metrics
Application/Server performance – track how your code is running in production, that way you can tell if you need to provision more servers or increase hardware specs to keep up with demand

Figure: Application Insights gives you information about how things are running and whether there are detected abnormalities in the telemetry
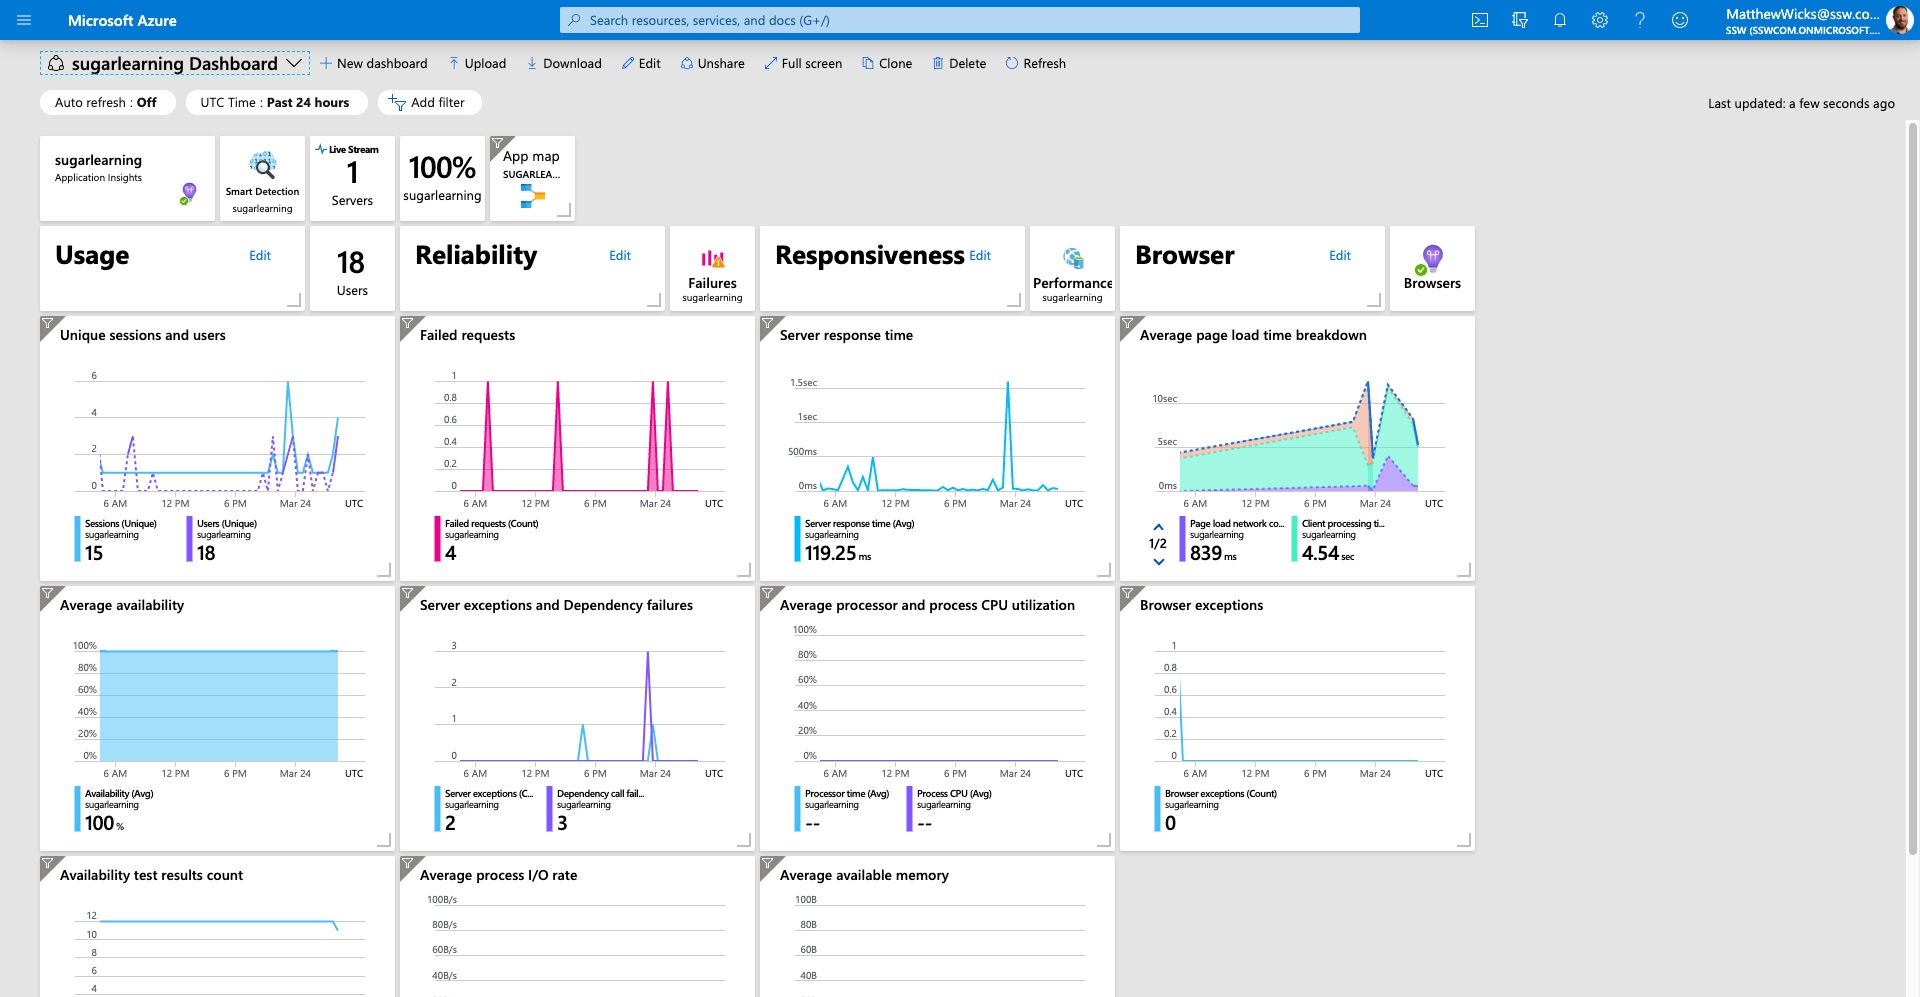
Figure: Azure can render the Application Insights data on a nice dashboard so you can get a high level view of your application
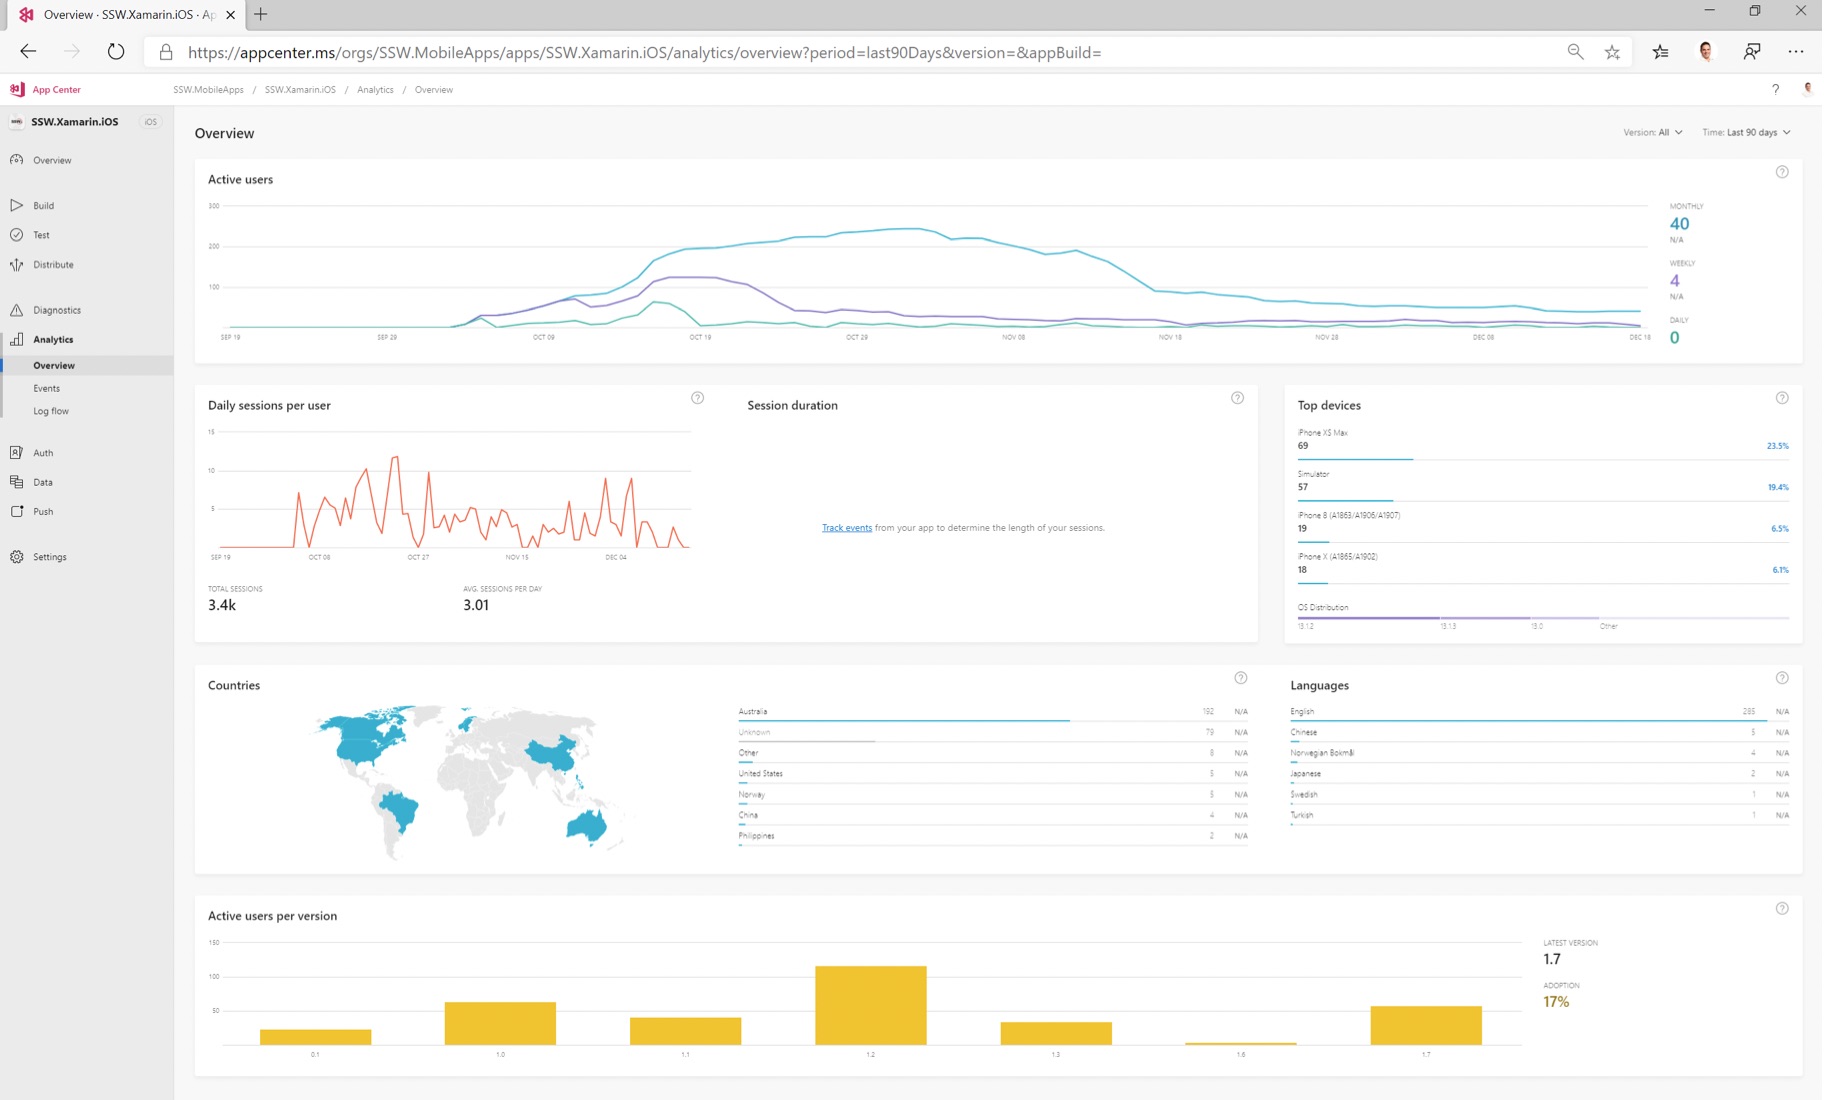
Figure: App Center can let you monitor app install stats, usage and errors from phones just like an app running in Azure
Process Metrics
Collecting stats about the application isn't enough, you also need to be able to measure the time spent in the processes used to develop and maintain the application. You should keep an eye on and measure:
- Sprint Velocity
- Time spent in testing
- Time spent deploying
- Time spent getting a new developer up to speed
- Time spent in Scrum ceremonies
- Time taken for a bug to be fixed and deployed to production
Code Metrics
The last set of metrics you should be looking at revolves around the code and how maintainable it is. You can use tools like:
- Code Analysis
DevOps – Stage 4: Do you continually improve processes?
Now that you’ve got the numbers, you can then make decisions on what needs improvement and go through the DevOps cycle again.
Here are some examples:
- For exceptions, review your exception log (ELMAH, RayGun, HockeyApp)
- Add the important ones onto your backlog for prioritization
- Add an ignore to the exceptions you don't care about to reduce the noise (e.g. 404 errors)
- You can do this as the exceptions appear, or prior to doing your Sprint Review as part of the backlog grooming
- You don't have to get the exception log down to 0, just action the important ones and aim to reduce the noise so that the log is still useful
- For code quality, add getting Code Auditor and ReSharper to 0 on files you’ve changed to your Definition of Done
- For code quality, add SonarQube and identify your technical debt and track it
- For application/server performance, add automated load tests, add code to auto scale up on Azure
- For application usage, concentrate on features that get used the most and improve and streamline those features
Do you evaluate the processes?
Often an incorrect process is the main source of problems. Developers should be able to focus on what is important for the project rather than getting stuck on things that cause them to spin their wheels.
- Are devs getting bogged down in the UI?
- Do you have continuous integration and deployment?
Note: Anyway keep this brief since it is out of scope. If this step is problematic, there are likely other things you may need to discuss with the developers about improving their process. For example, are they using Test Driven Development, or are they checking in regularly... all this and more should be saved for the Team & Process Review.
Do you record incidents and perform root cause analysis with clear actions?
When high-impact incidents occur - such as website outages, data loss, or critical bugs in production - fixing the immediate issue isn't enough.
Without a structured process to capture what happened, identify the root causes, and implement improvements, the same problems can happen again. This rule defines a simple post-incident process to help teams learn from failure, prevent repeat issues, and improve software and business processes.
Record the incident
As soon as possible, assign someone to record the key details:
- When was the issue first noticed?
- What symptoms were observed? (e.g. errors, downtime)
- Who responded, and when?
- What actions were taken?
- When and how was the incident resolved?
Capture these in a central place - if your monitoring system creates PBIs automatically, use comments in the ticket to log the incident timeline and key facts.
Analyse the root cause
Hold a blameless post-incident review with everyone involved. Use structured techniques like:
Tip: Don't stop at technical causes - also consider process gaps, unclear responsibilities, or communication failures.
Document and implement recommendations
For each contributing factor, define clear and actionable recommendations:
- Describe the fix or change needed
- Link to related PRs, logs, or tasks
Each recommendation must have a dedicated PBI. The Product Owner is responsible for ensuring these PBIs are estimated, prioritised, and scheduled. Teams should review them during Sprint Planning or Backlog Refinement.
Summary
A well-handled incident isn't just about restoring service - it's a chance to make meaningful improvements.
By recording incidents, analysing causes, and implementing clear actions, teams reduce risk, increase reliability, and turn failures into progress.
Do you know when to override branch protection rules?
You should be using branch protection rules to protect your main branch in your source repository. These can include minimum number of reviewers, specific required reviews, passing tests, or code quality checks. These help you maintain quality standards in your product, but you can override these checks with a privileged account and, sometimes, you should.
Most source code repositories (including Azure DevOps and GitHub) allow you to set branch protection rules, meaning code must meet a set of conditions before it can be merged into the main branch. But administrators, or individuals with the appropriate delegated authority, can bypass these checks and merge code without these conditions being met.
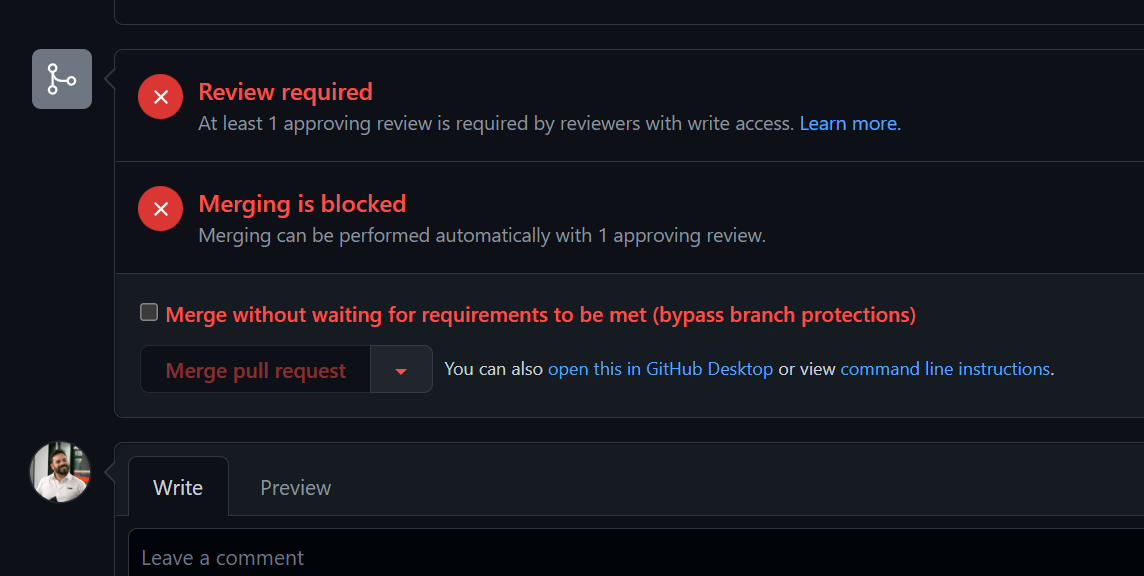
Figure: A Pull Request in GitHub that has not met the requirements of the branch protection rule. However, as the person viewing this is a repository administrator, an option is available to bypass the branch rules and merge the code
When SHOULDN'T you override branch protection rules?
Just because you hold the keys, doesn't mean that you should infer a license to merge code at your own behest when it overrides protections that have been put in place for a reason.
For example, if a PR is blocked because a reviewer has requested changes, you shouldn't use your privileges to override the branch protection rules to avoid making the requested changes. Just like with any other privileged account, with great power there must also come great responsibility, and it's your responsibility to use those privileges for the purpose they were granted, and not for your own convenience.
When SHOULD you override branch protection rules?
While branch protection is an awesome feature and, when done right, can allow you to automate your review process and even remove the need for human approvers. But sometimes it creates a bottleneck that can present its own issues. One example might be if you need to merge an urgent fix to resolve a production issue. Another might be that you have a failed test runner, which could cause all of your tests to fail and block all pull requests.
What to do if you have to override branch protection rules
Depending on the severity of the situation, you may need to act quickly. But you should always attempt to get authorisation from the Product Owner first, and document it.
The most important thing to do, though, is to re-evaluate your processes. On rare occassions you may find that overriding branch protection rules was a one-off necessity, but it will often also highlight a weakness in your processes.
This doesn't necessarily mean a problem with the rules themselves (although of course it could). For example, if you have an urgent fix and your rules require at least one reviewer, but you can't find anyone to review your PR, you may need to override the protection rules on this occassion. This wouldn't highlight a need remove that protection rule, but it would highlight a need to investigate availability of reviewers.
Like any process involving privileged access, it's up to you to exercise your discretion, and use common sense to determine whether your privilege should be exercised, and whether exercising that privilege highlights a need for a change in process somewhere along the chain.
Do you know how DevOps fits in with Scrum?
DevOps and Scrum compliment each other very well. Scrum is about inspecting and adapting with the help of the Scrum ceremonies (Standup, Review, Planning and Retro). With DevOps it's all about Building, Measuring and Improving with the help of tools and automation.

Figure: Traditional Scrum process
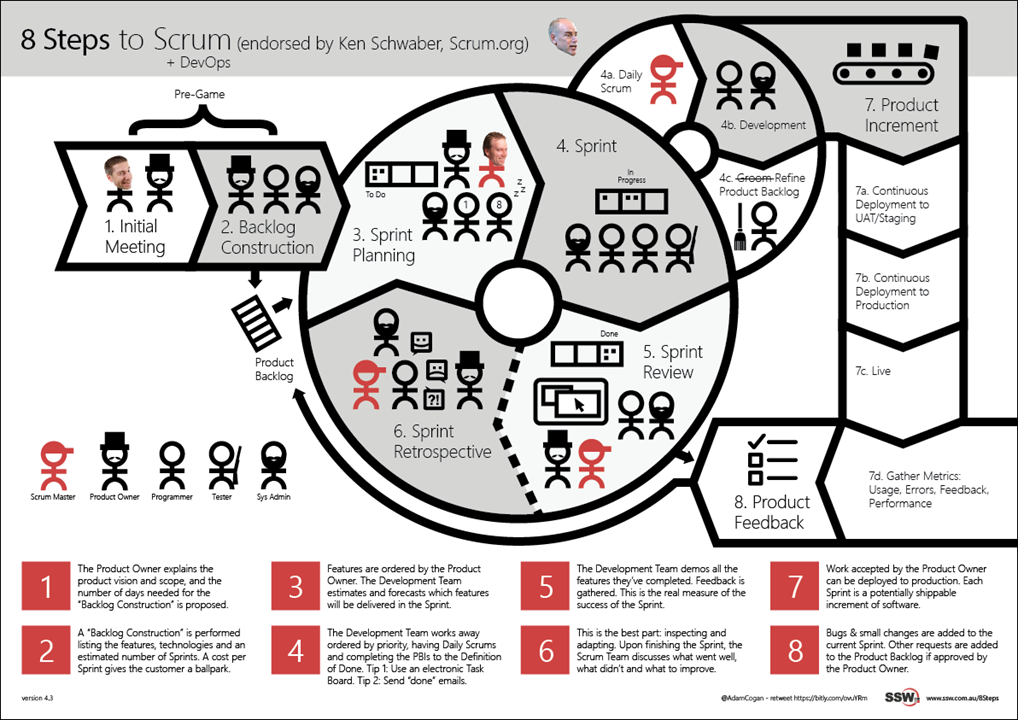
✅ Figure: Scrum with DevOps
With DevOps, we add tools to help us automate slow process like build and deployment then add metrics to give us numbers to help quantify our processes. Then we gather the metrics and figure out what can be done to improve.
For example with Exception Handling, you may be using a tool like Raygun.io or Elmah and have 100s of errors logged in them. So what do you do with these errors? You can:
- Add each one to your backlog
- Add a task to each Sprint to "Get exceptions to 0"
The problem with the above is that not all exceptions are equal, and most of the time they are not more important than the planned PBIs being worked on. No developers like working a whole Sprint just looking at exceptions. What should happen is:
- Have the exceptions visible in your development process (i.e. using Slack, adding as something to check before Sprint Planning)
- Triage the exceptions, either add them to the backlog if they are urgent and important
- Add ignore filters to the exception logging tool to ignore errors you don't care about (e.g. 404s)
- Prioritize the exceptions on the backlog
The goal here is to make sure you're not missing important and to reduce the noise. You want these tools to help support your efforts and make your more productive and not just be another time sink.
Do you have a DevOps Checklist?
DevOps (Developers and IT Operations) is a phrase used to describe the relationship and/or communication between Developers and IT Operations.
A DevOps checklist is a simple document that allows development teams to note all of the tasks related to monitoring and application life cycle along with their quality metrics and place them into one of three categories:
- Always Tasks Always Tasks are tasks that should be performed before the start of a new PBI.
- Daily Tasks Tasks that are performed at the start of each day.
- End of Sprint Tasks Tasks that are performed at the end of each Sprint.
Basic Action / Task Format
Actions or Tasks follow a basic format of: Action / Task Name | Where the task can be performed | Quality Metric
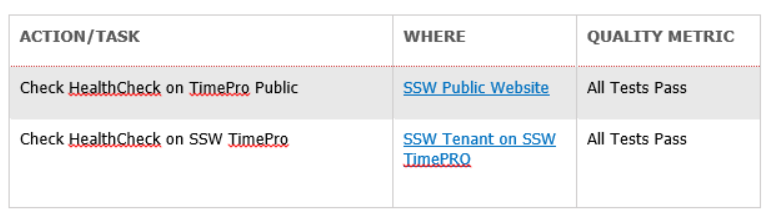
✅ Figure: Figure: Good example of a Basic Action Table format
This can be stored in the Repo's README or the wiki to make it visible (so you don't forget). Learn more about awesome documentation.
Do you know how to assign Azure DevOps permissions effectively?
When setting Azure DevOps permissions, it is important to give people only the permissions they need to do their job, rather than giving blanket admin access. This approach helps to minimize the risk of unwanted changes or errors, as well as ensure that sensitive data is only accessible to those who need it.
How to give write access to a project without admin rights
Instead of giving Project Admin access to all team members in Azure DevOps, it is recommended to give specific permissions only for the areas or iterations they need to work on. This can be done by allowing users to create nodes under the specific area or iteration they are responsible for, rather than giving them blanket access to the entire project.
Example: To create Sprints in Azure DevOps, you only need two bits of permission:
- Create child nodes on the backlog node for the team. a. Navigate to the project in Azure DevOps | Project Settings b. Under "Boards" select Project configuration | Click on the ellipses (...) on Interations | Security c. Add users and assign particular permission.
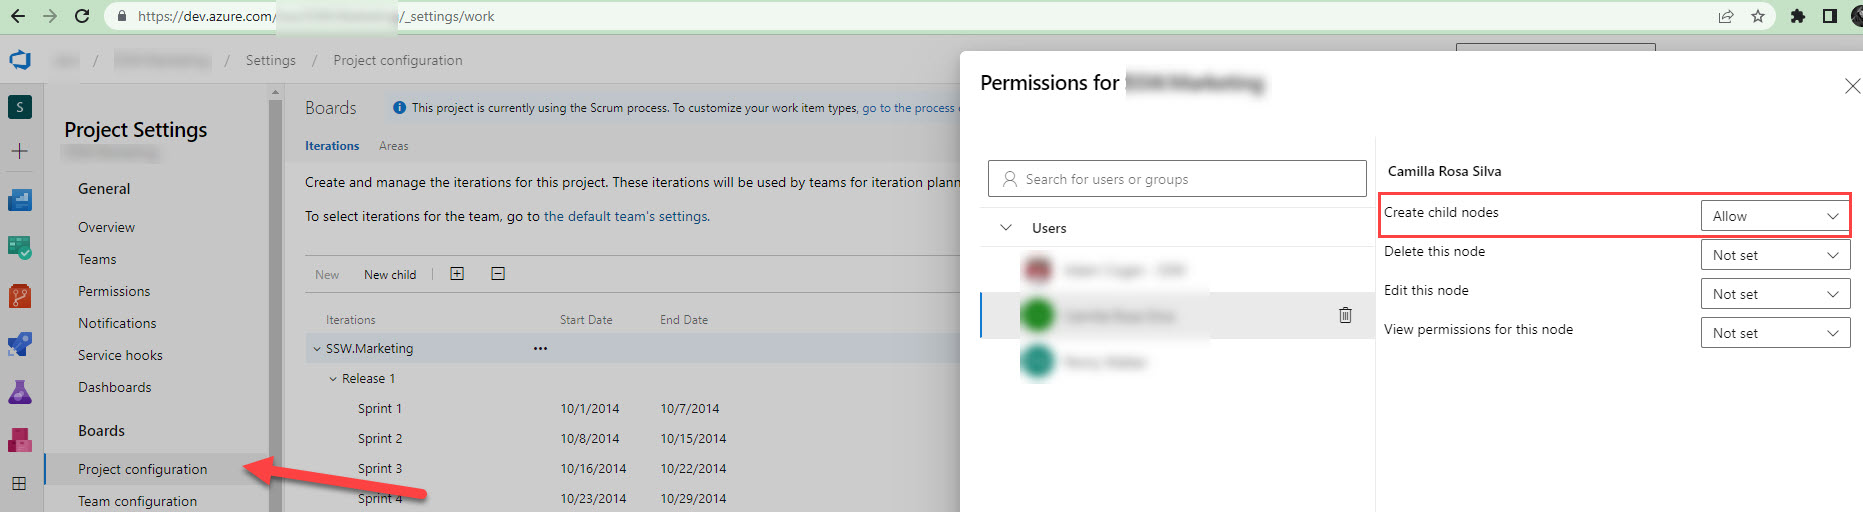
Figure: Assign limited access to a particular user to create a Sprint
- You need to be a team admin, in order to add the newly created iteration to the team iterations.
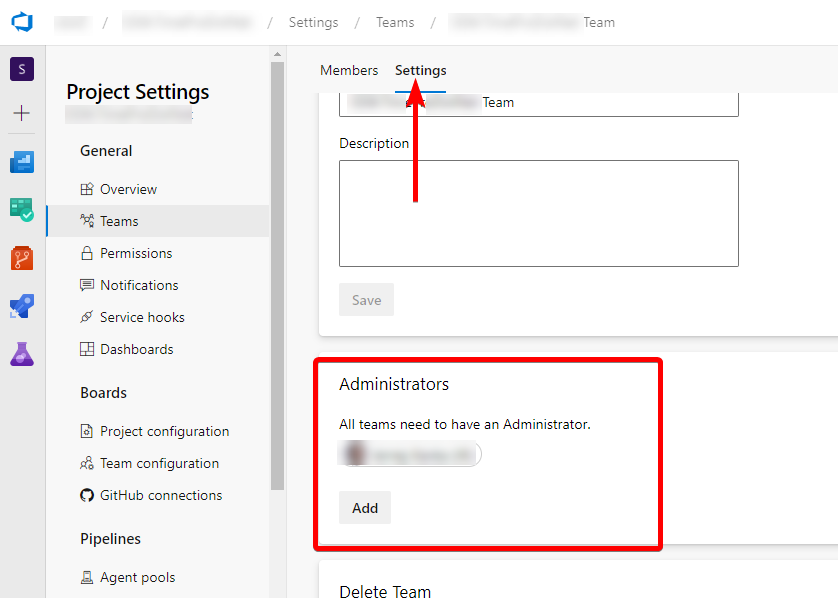
Figure: Team Administrator - Who have access to iterations in Azure DevOps
By following this rule and giving people only the specific permissions they need, you can help to ensure that Azure DevOps permissions are set up in a way that maximizes productivity and minimizes the risk of errors or unwanted changes.
Do you know the best free resources for learning DevOps?
DevOps learning resources
- DevOps introduction: The Complete DevOps Roadmap 2024
- Azure DevOps: Azure DevOps Labs
- Event: GitHub Universe
- Book: The Phoenix Project
Great general advice
- Blog: Microsoft DevOps Journey
- Watch: The DevOps Journey So Far (great overview of the scope of DevOps)
Important tech to skill up in
Reviewing projects
When reviewing projects make sure to ask these questions.
- Onboarding - How quick is f5?
- Deploying - How quick is deployment?
- Daily Health - Are the errors visible?
- Documentation – Check wiki to see documented process
- Deploying - Don’t duplicate builds/steps etc
See survey on DevOps – Stage 1: Do you know what things to measure?
Do you know why to use Application Insights?
Knowing the holistic health of your application is important once it has been deployed into production. Getting feedback on your Availability, errors, performance, and usage is an important part of DevOps. We recommend using Application Insights, as getting it set up and running is quick, simple and relatively painless.
Application Insights will tell you if your application goes down or runs slowly under load. If there are any uncaught exceptions, you'll be able to drill into the code to pinpoint the problem. You can also find out what your users are doing with the application so that you can tune it to their needs in each development cycle.
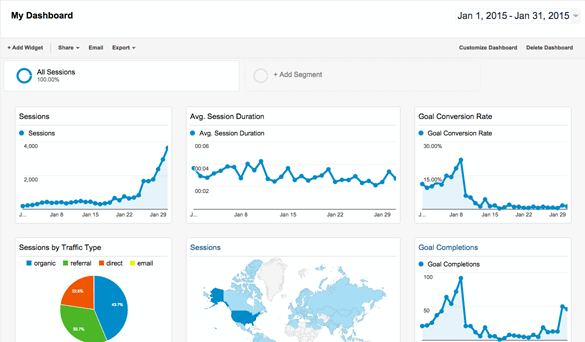
Figure: When developing a public website, you wouldn't deploy without Google Analytics to track metrics about user activity.
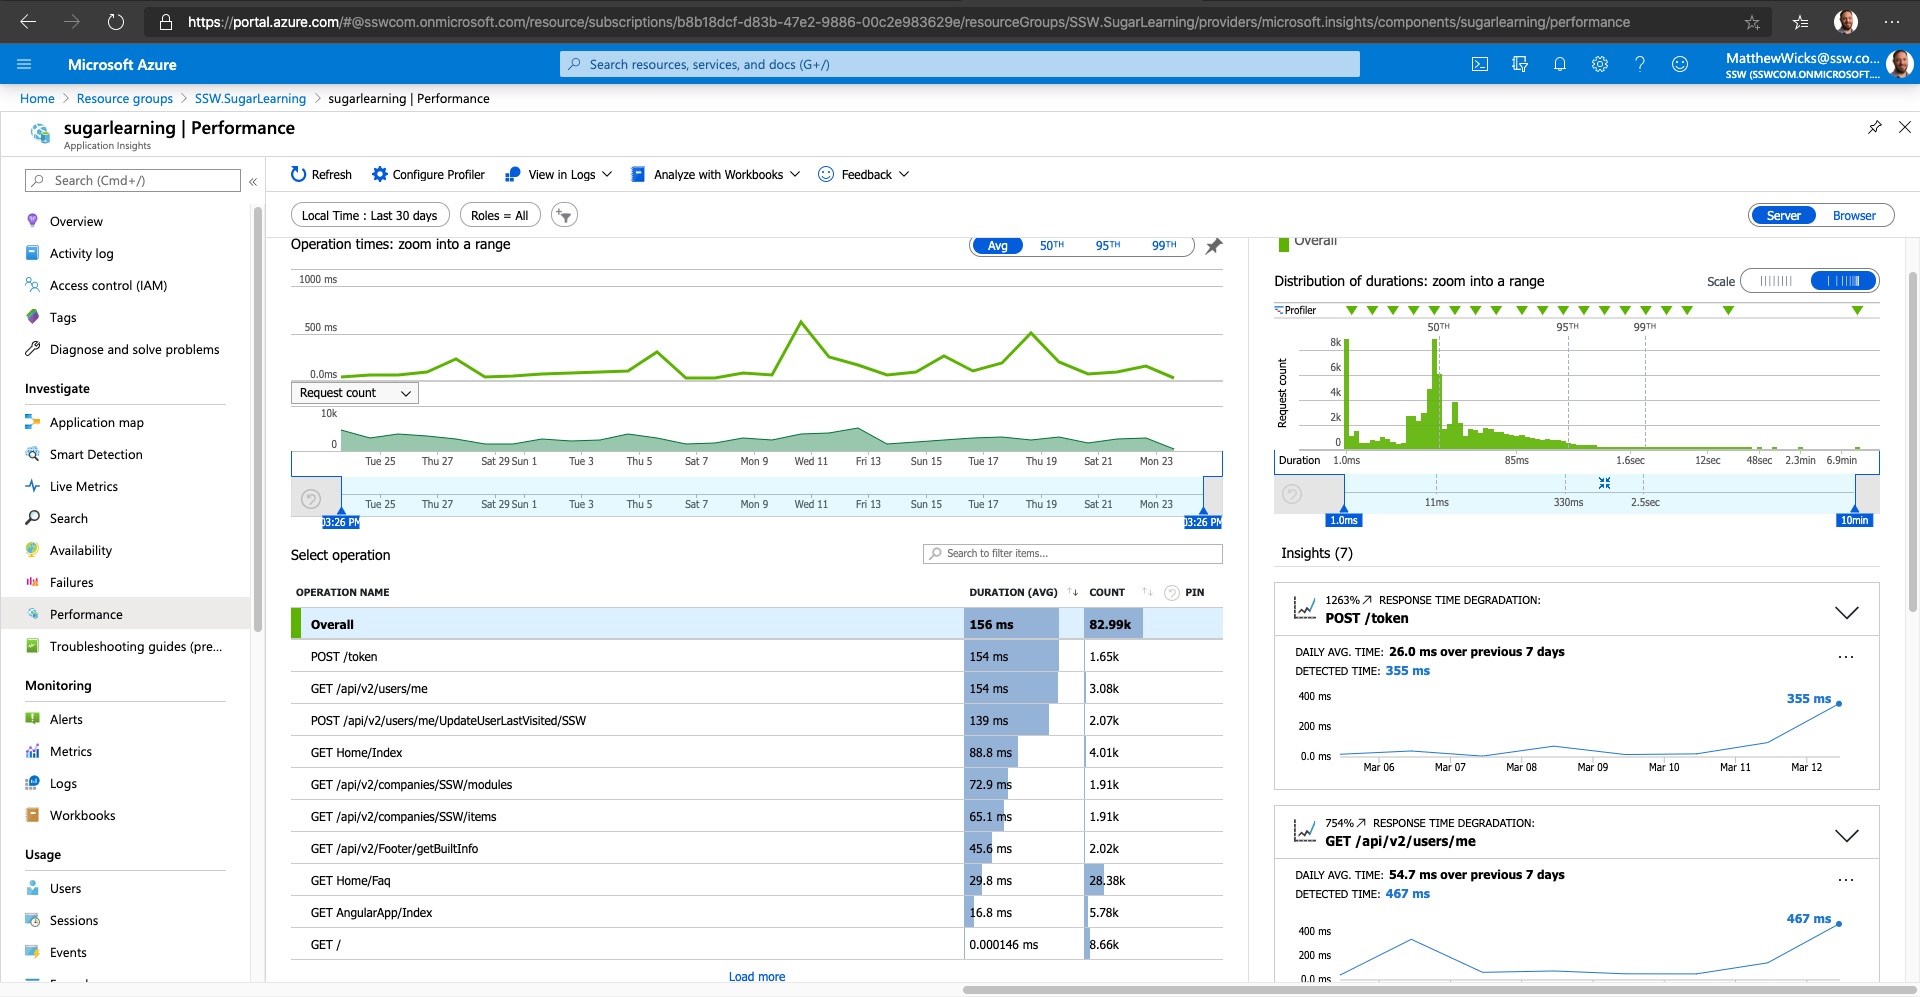
Figure: For similar reasons, you shouldn't deploy a web application without metric tracking on performance and exceptions
- You need a portal for your app
- You need to know spikes are dangerous
- You need to monitor:
- Errors
- Performance
- Usage

Figure: Spikes on an Echidna are dangerous

Figure: Spikes on a graph are dangerous
To add Application Insights to your application, make sure you follow the rule Do you know how to set up Application Insights?
Can't use Application Insights? Check out the following rule Do you use the best exception handling library ?
Do you keep Failed Requests clean?
Application Insights provide crucial insights into the health and performance of the application. Failed Requests allow the DevOps specialists to identify the specific errors and exceptions occurring in the application. However, keeping Failed Requests clean is crucial to troubleshoot and pinpoint the root causes of the problems efficiently. A cluttered failed requests list filled with irrelevant entries can make it difficult to identify the critical issues that require immediate attention.
Video: Do you keep Failed Requests clean? (5 min)Understand your Failed Requests
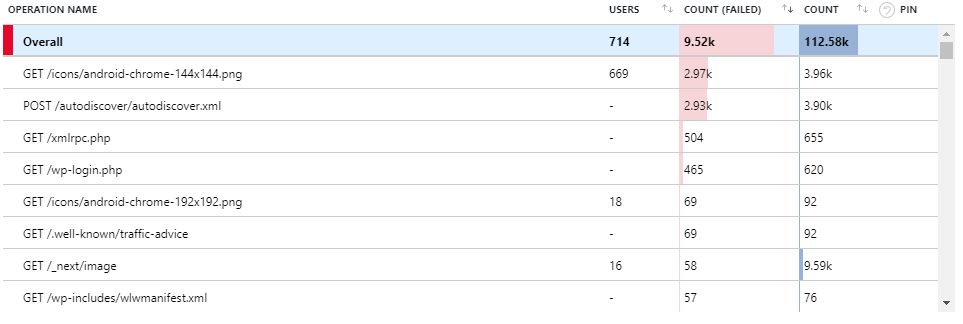
When cleaning up Failed Requests, it is important to identify the patterns between frequent offenders and categorize them into the following three categories:
- Irrelevant – Failed Requests that you expect but cannot do anything about. Examples: 404 responses to “/autodiscover.xml”, “/robots933456.txt”.
- Probing Attempts – Inbound requests targeting non-existent URLs in your application. These requests often originate from bots seeking common vulnerabilities. A properly configured Web Application Firewall (WAF) should identify and mitigate such traffic i.e. this should be empty. Examples: 404 responses to requests for '.php' or 'Wordpress' endpoints not present in your .NET application.
- Fixable – Failed Requests that you identify as bugs in your application. You can identify these requests by their URL belonging to the real endpoints or files in your application. Create PBIs for these bugs, and if you cannot fix any of them yourself, pass them on to the people who can. Examples: 404 responses from missing images, 400 responses from API.
Note: Not everything you encounter can be matched to a pattern or fixed straight away.
If that is the case, continue to other requests. As the logs become cleaner, it will get easier to understand the problems with the left-over requests.
Tip: Splitting the chart based on response codes may make patterns clearer. For instance, 500 responses will almost always be fixable bugs worth investigating.
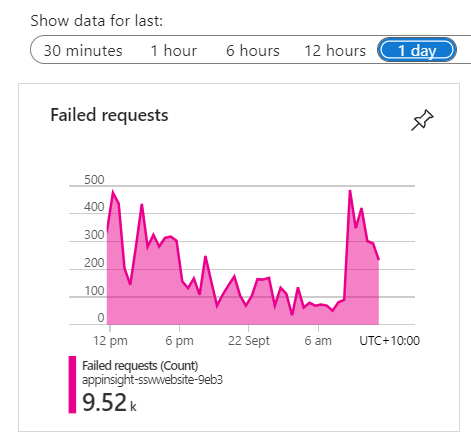
❌ Figure: Bad example - Default Chart - at least half of requests are irrelevant or spam
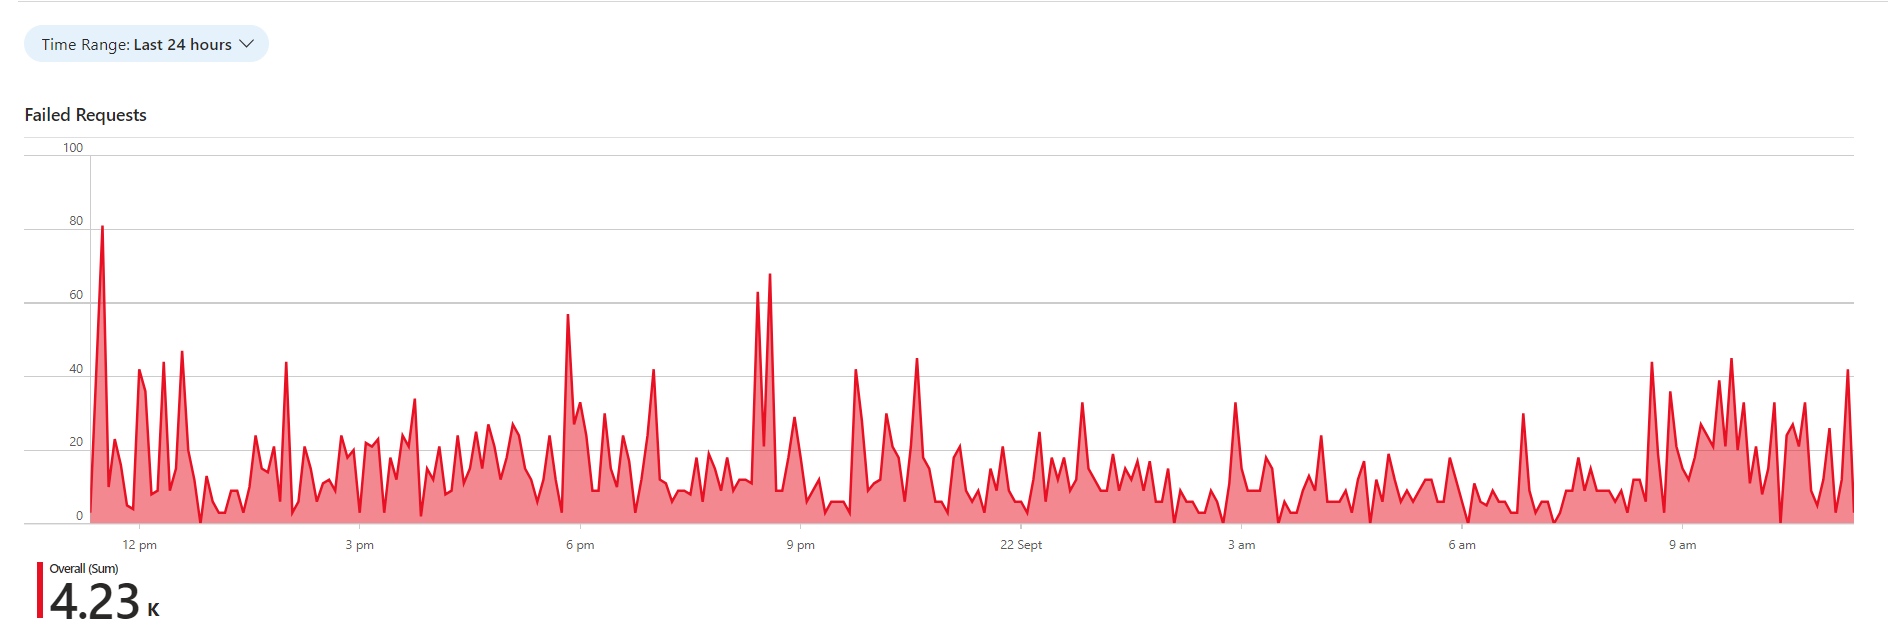
✅ Figure: Good example - Custom Chart - most of these are real issues
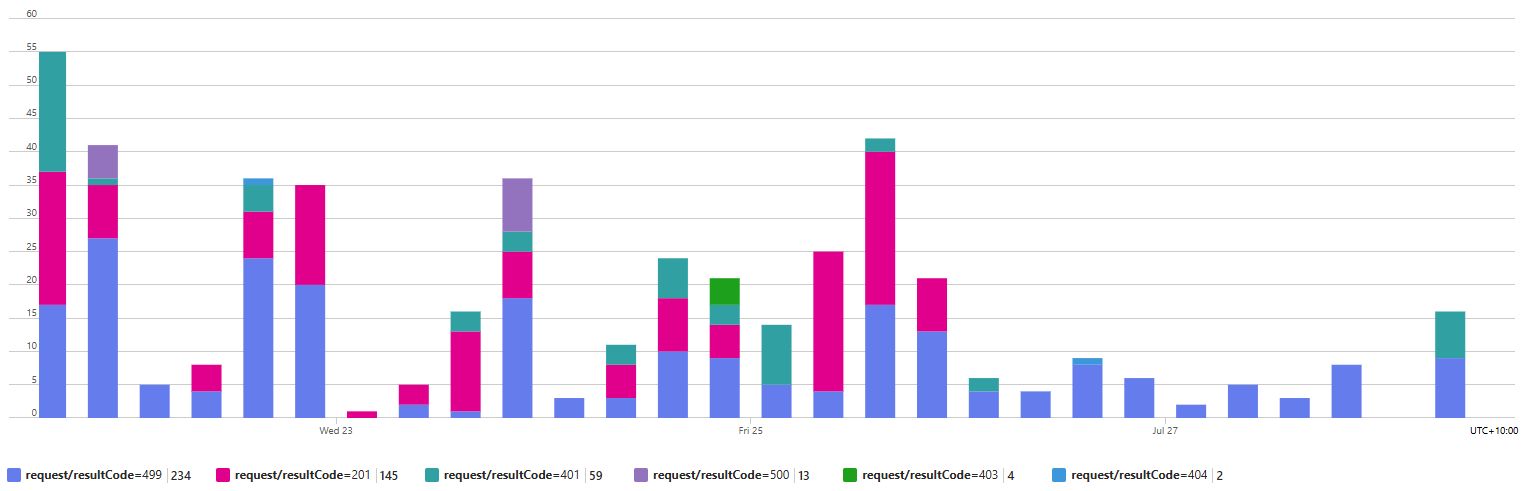
✅ Figure: Good example - Split Chart - the fixable 500 responses can be seen in purple
❌ Figure: Bad example - Default Table - 5 out of top 8 failed requests are irrelevant or spam
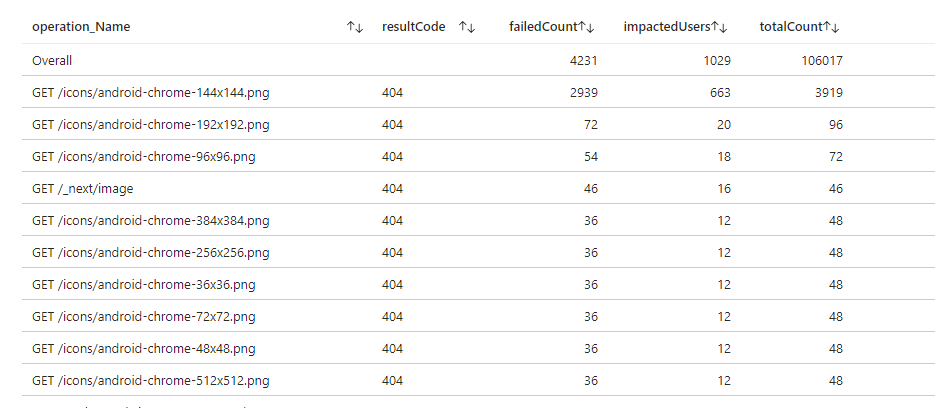
✅ Figure: Good example - Custom Table - all the top failed requests are real issues
Clean your Failed Requests
While the Fixable Failed Requests can be dealt with by resolving their underlying causes, the other two categories will continue to clutter your Application Insights.
You can use Application Dashboard and Azure Workbook to filter out any unwanted failed requests and display only useful information.
Application Dashboard is a customizable interface that provides an overview of an application's performance and health. You can access it at the top of the Overview page of your Application Insights. If the Application Dashboard was not yet created, you must have a Contributor Role in that Resource Group. A new Application dashboard automatically displays various charts, metrics, and alerts to monitor application behavior.
Azure Workbooks is a tool that allows users to create customized dashboards for data visualization and reporting on Azure resources. You can use it to create charts and tables with custom queries in Kusto Query Language (KQL), and then pin them to your Application Dashboard. By using the custom Kusto query, it is possible to filter out any unwanted Failed Requests for your custom chart!
Tip: You do not need to write your query from scratch!
Go to Application Insights | Failures | View in Logs | Failed request count.
<imageEmbed alt="Image" size="large" showBorder={false} figureEmbed={{ preset: "default", figure: 'Access default Failed Requests query - Application Insights | Failures | View in Logs | Failed request count', shouldDisplay: true }} src="/uploads/rules/clean-failed-requests/failed-requests-logs.png" />This will provide you with the default query, that you can customize and test in Azure Logs, before saving it in Workbooks.
<imageEmbed alt="Image" size="large" showBorder={false} figureEmbed={{ preset: "default", figure: 'Save Azure Logs Query in Workbooks - Pin to | Send to workbook', shouldDisplay: true }} src="/uploads/rules/clean-failed-requests/send-to-workbook.png" />When your Workbook is ready and the custom query filters out any unwanted failed requests, you just need to pin its chart component to the Application Dashboard. If you click on the component from the Workbook, that is pinned to the Application Dashboard, it will take you inside the workbook. This way, you can use Workbook as a drill-down view for your pinned chart.
Do you know how to analyse your web application usage with Application Insights?
You've set up your Application Insights as per the rule 'Do you know how to set up Application Insights.
Your daily failed requests are down to zero & You've tightened up any major performance problems.
Now you will discover that understanding your users' usage within your app is child's play.
The Application Insights provides devs with two different levels of usage tracking. The first is provided out of the box, made up of the user, session, and page view data. However, it is more useful to set up custom telemetry, which enables you to track users effectively as they move through your app.
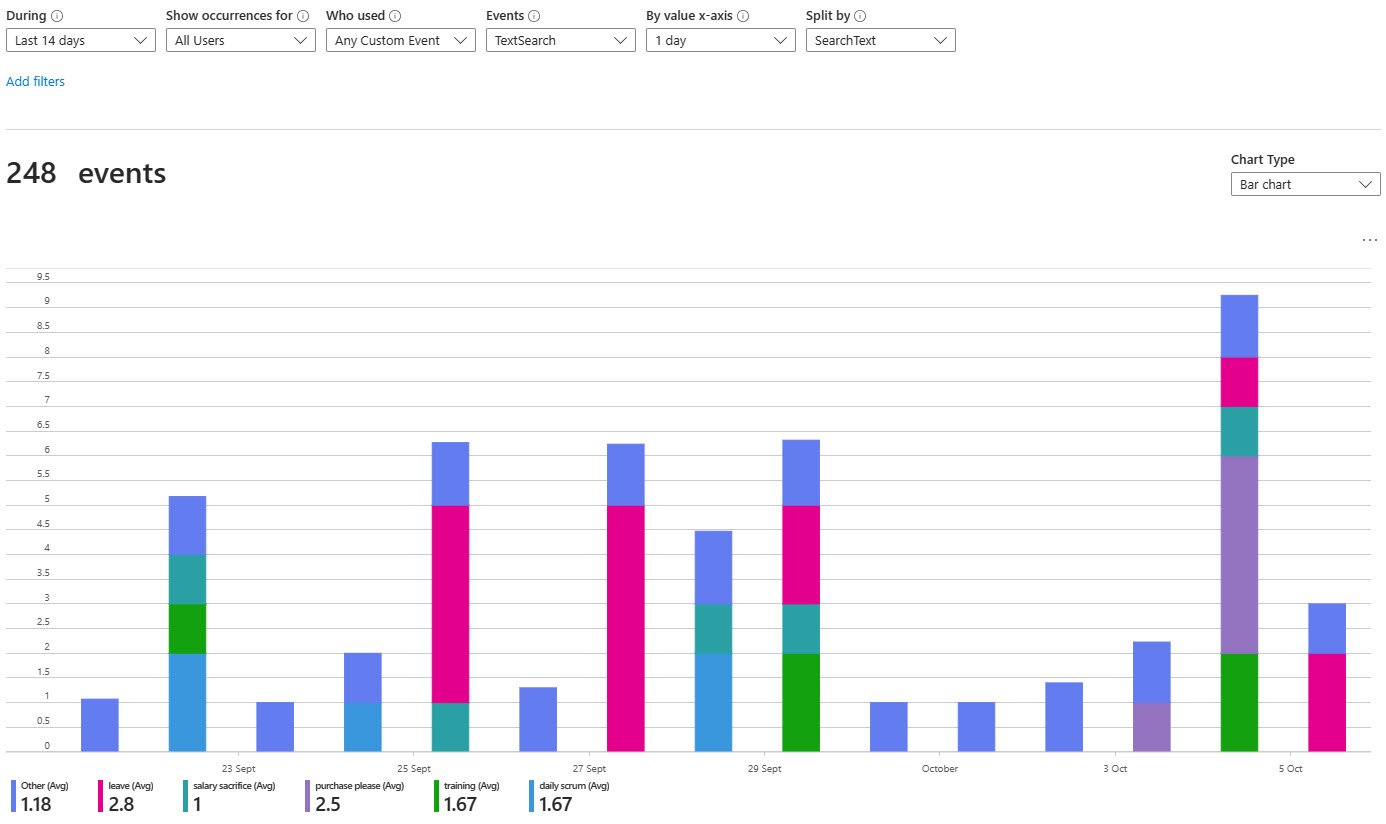
Figure: Easily track and compare custom events
It is very straightforward to add these to an application by adding a few lines of code to the hot points of your app. Follow Application Insights API for custom events and metrics to learn more.
If you feel constricted by the Application Insights custom events blade? Then you can export your data and display it in PowerBI, take a look at Using Azure Log Analytics in Power BI
Do you know how to find performance problems with Application Insights?
Once you have set up your Application Insights as per the rule 'Do you know how to set up Application Insights' and you have your daily failed requests down to zero, you can start looking for performance problems. You will discover that uncovering your performance related problems are relatively straightforward.
The main focus of the first blade is the 'Overview timeline' chart, which gives you a birds eye view of the health of your application.
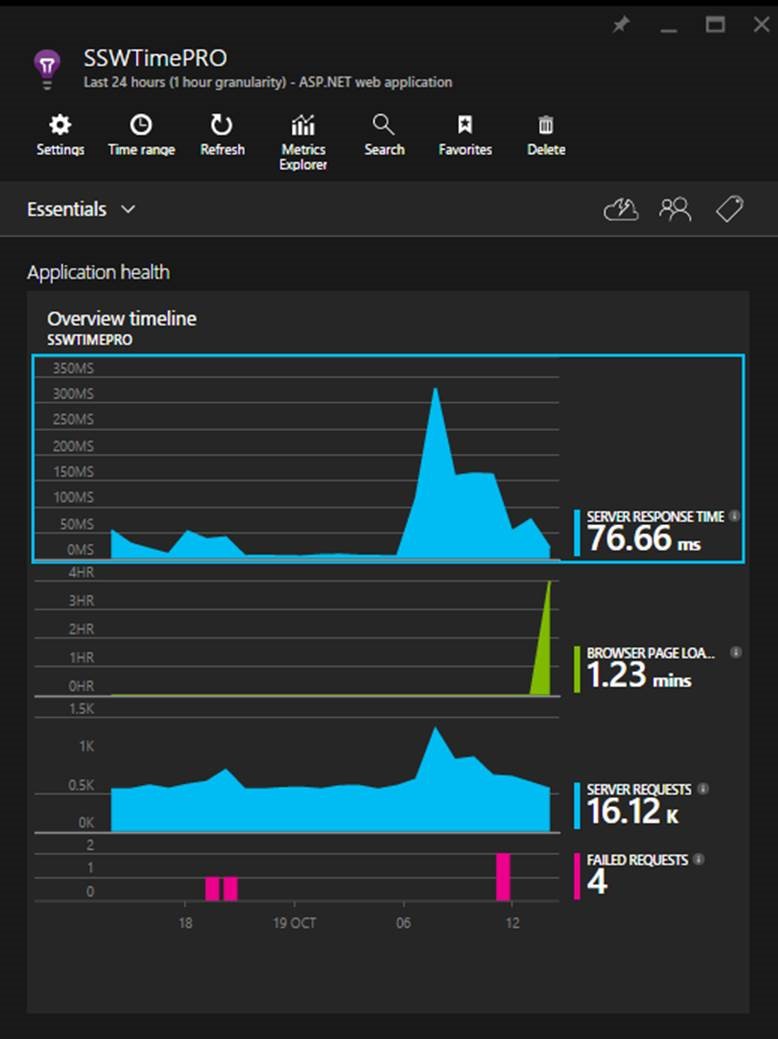
Figure: There are 3 spikes to investigate (one on each graph), but which is the most important? Hint: look at the scales!
Developers can see the following insights:
- Number of requests to the server and how many have failed (First blue graph)
- The breakdown of your page load times (Green Graph)
- How the application is scaling under different load types over a given period
- When your key usage peaks occur
Always investigate the spikes first, notice how the two blue ones line up? That should be investigated, however, notice that the green peak is actually at 4 hours. This is definitely the first thing we'll look at.
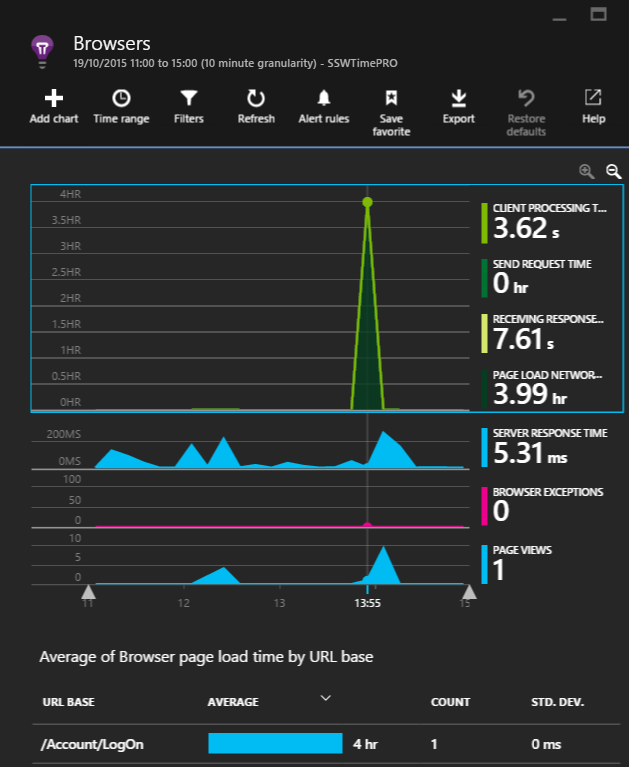
Figure: The 'Average of Browser page load time by URL base' graph will highlight the slowest page.
As we can see that a single request took four hours in the 'Average of Browser page load time by URL base' graph, it is important to examine this request.
It would be nice to see the prior week for comparison, however, we're unable to in this section.
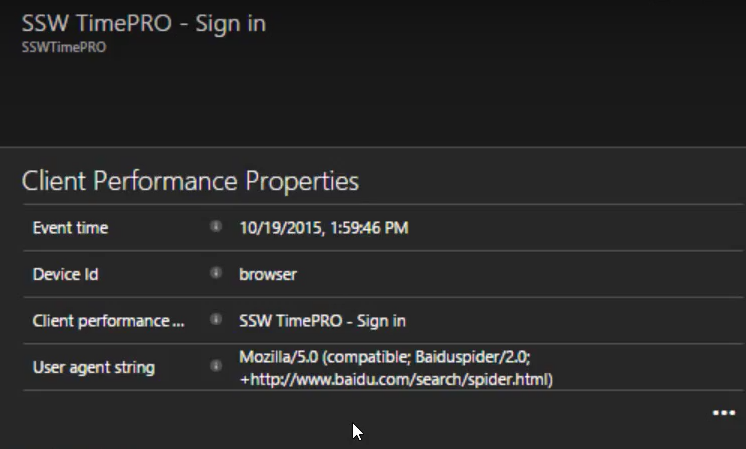
Figure: In this case, the user agent string gives away the cause, Baidu (a Chinese search engine) got stuck and failed to index the page.
At this point, we'll create a PBI to investigate the problem and fix it.
(Suggestion to Microsoft, please allow annotating the graph to say we've investigated the spike)
The other spike which requires investigation is in the server response times. To investigate it, click on the blue spike. This will open the Server response blade that allows you to compare the current server performance metrics to the previous weeks.
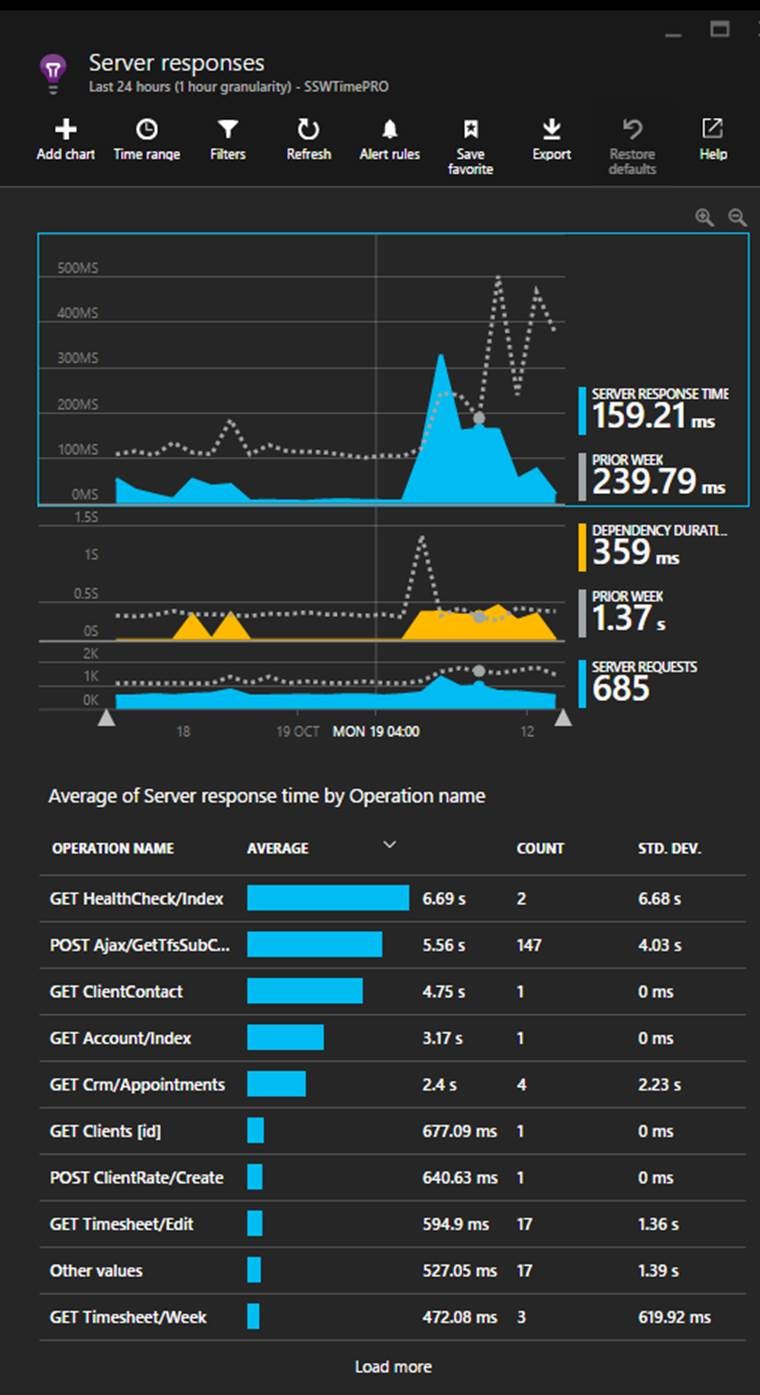
Figure: In this case, the most important detail to action is the Get Healthcheck issue. Now you should be able to optimise the slowest pages
In this view, we find performance related issues when the usage graph shows similarities to the previous week but the response times are higher. When this occurs, click and drag on the timeline to select the spike and then click the magnifying glass to ‘zoom in’. This will reload the ‘Average of Server response time by Operation name’ graph with only data for the selected period.
Looking beyond the Average Response Times
High average response times are easy to find and indicate an endpoint that is usually slow - so this is a good metric to start with. But sometimes a low average value can contain many successful fast requests hiding a few much slower requests.
Application insights plots out the distribution of response time values allowing potential issues to be spotted.
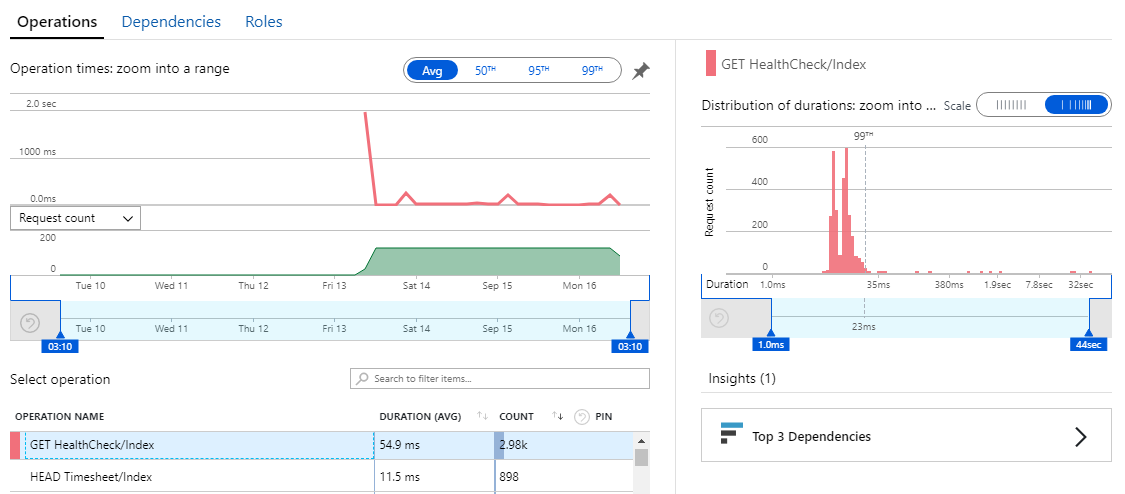 **Figure: this distribution graph shows that under an average value of 54.9ms, 99% of requests were under 23ms but there were a few requests taking up to 32 seconds!
**
**Figure: this distribution graph shows that under an average value of 54.9ms, 99% of requests were under 23ms but there were a few requests taking up to 32 seconds!
**Errors – Do you know the daily process to improve the health of your web application?
Application Insights can provide an overwhelming amount of errors in your web application, so use just-in-time bug processing to handle them.
The goal is to each morning check your web application's dashboard and find zero errors. However, what happens if there are multiple errors? Don't panic, follow this process to improve your application's health.
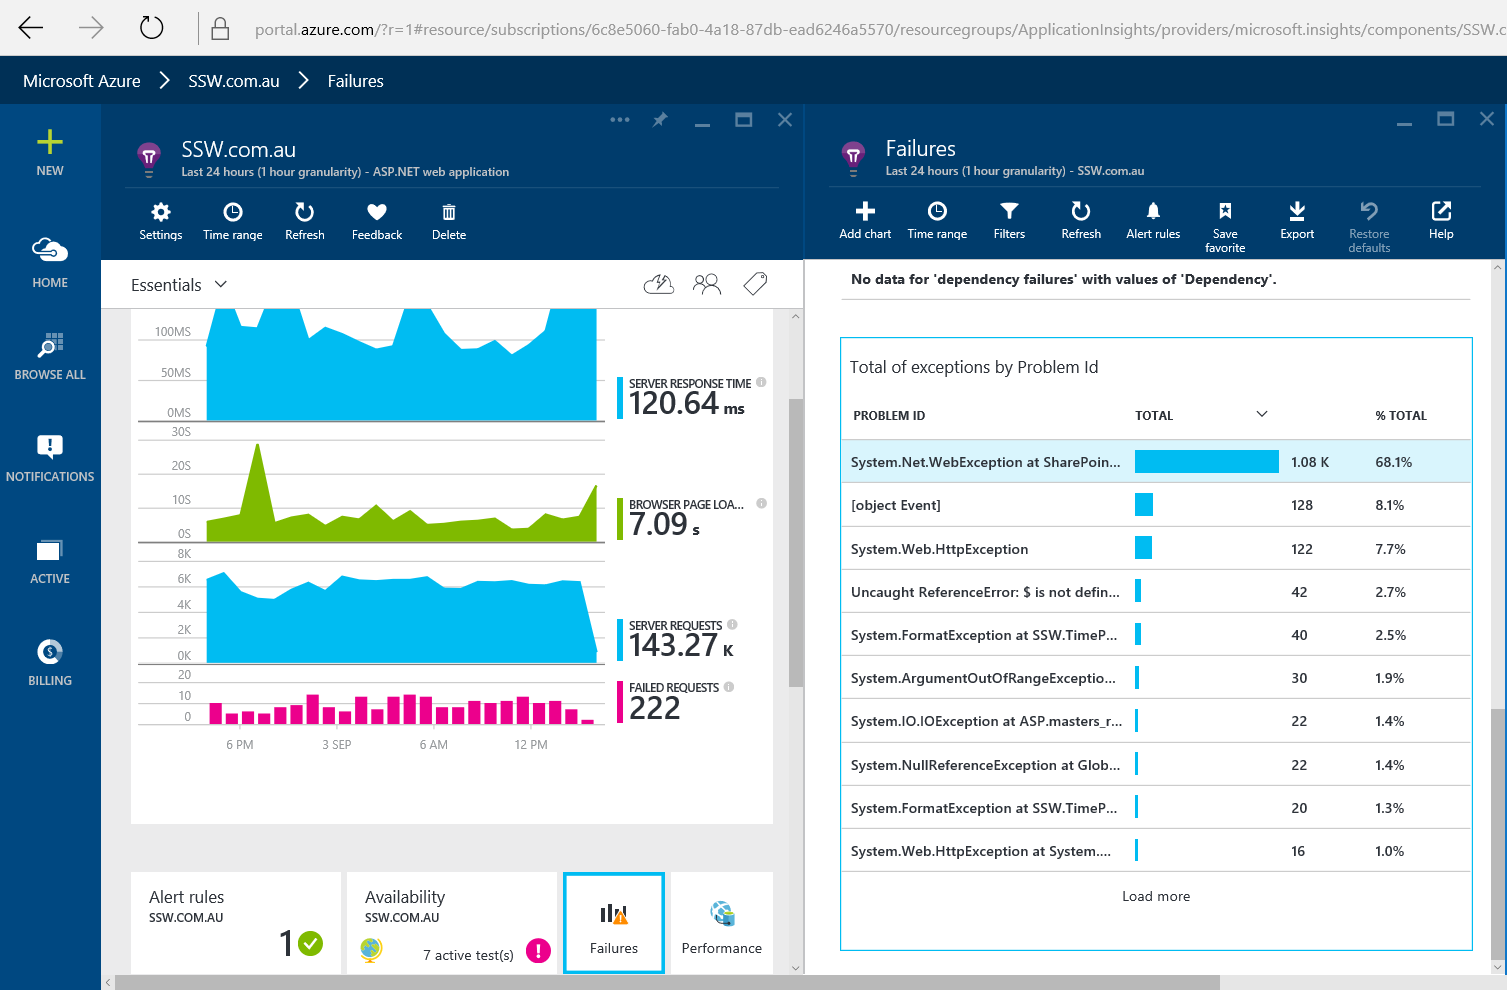
Figure: Every morning developers check Application Insights for errors
Once you have found an exception you can drill down into it to discover more context around what was happening. You can find out the user's browser details, what page they tried to access, as well as the stack trace (Tip: make sure you follow the rule on How to set up Application Insights to enhance the stack trace).
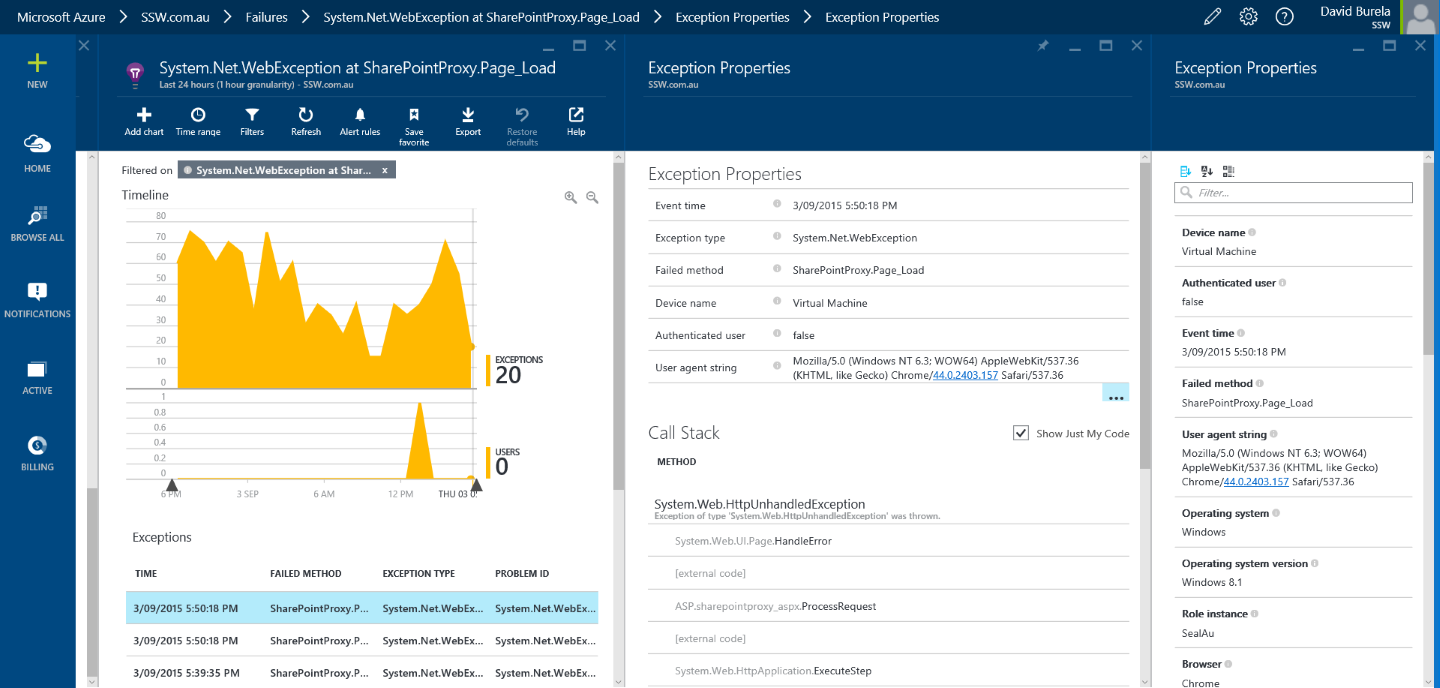
Figure: Drilling down into an exception to discover more.
It's easy to be overwhelmed by all these issues, so don't create a bug for each issue or even the top 5 issues. Simply create one bug for the most critical issue. Reproduce, fix and close the bug then you can move onto the next one and repeat. This is just-in-time bug processing and will move your application towards better health one step at a time.
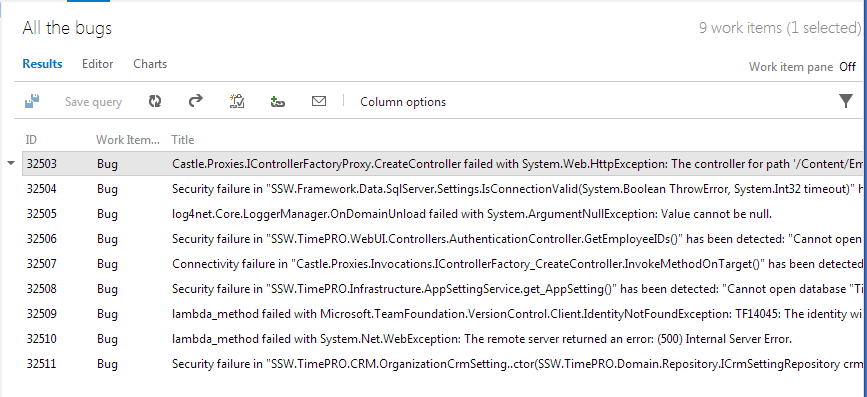
❌ Figure: Bad example - creating all the bugs
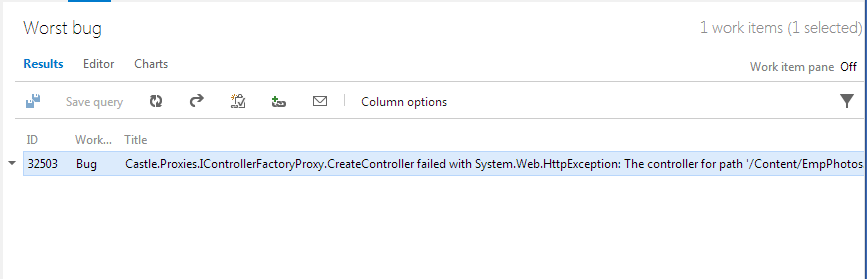
✅ Figure: Good example - create the first bug (unfortunately bug has to be created manually)
Do you customize your DevOps board styles?
The Azure DevOps boards are powerful tools for planning your work.
They are also highly customizable, which means you can communicate additional information that helps visualize your team's work by making your board work harder for you.
Using the styling rules in your DevOps Board, you can use conditional formatting to color-code or add visual tags based on specific criteria, including:
- Setting a PBI as a Sprint Goals
- Who they are assigned to
- High-priority items
- Stale/old tasks (e.g. if a task or PBI has remained unchanged for a number of days)
To learn how to customize your board, see the walkthrough video below:
Video: Azure DevOps | Customizing your Board (15 mins)For more information, read Microsoft's article - Customize cards on a Sprint taskboard in Azure Boards.
Do you automate code reviews on GitHub?
Developers love submitting Pull Requests (PRs) but far fewer enjoy reviewing them. In particular, when Sprint Review approaches, developers get tunnel vision and only focus on tasks they've been assigned. By leveraging AI agents, you can catch many problems and gotchas in your PRs early, buying your senior devs more time (and sanity!) to review higher quality code.
Video: Code review & refactoring with GitHub Copilot: A beginner's guide (8 min)To learn how to configure GitHub Copilot code reviews refer to GitHub's setup documentation.
In a perfect world, reviewing a PR would simply be rubber-stamping perfect code. In reality, reviewers spend a lot of time flagging comments, typos, linting problems and, eventually bugs. This takes time away from focusing on more valuable concerns like scalability, maintainability, extensibility, and, ultimately the longevity of the code.
Enter AI agents. AI Agents such as GitHub Copilot are great at improving code quality before putting the PR in front of a senior. By making your code more enjoyable to review, you'll find people won't disappear under a rock whenever you ping them with a PR.
There's a few agents developers can choose for their PR reviewing needs.
GitHub Copilot Code Reviews ⭐ (recommended)
GitHub Copilot Pro users may request code reviews from GitHub Copilot manually, or configure automatic code reviews by GitHub Copilot whenever they make a Pull Request. Copilot will also suppress any reviews it generated with low confidence intervals, filtering out any code suggestions that are likely incorrect.
Tip: If you still have your student status, you can get GitHub Copilot Pro for free.
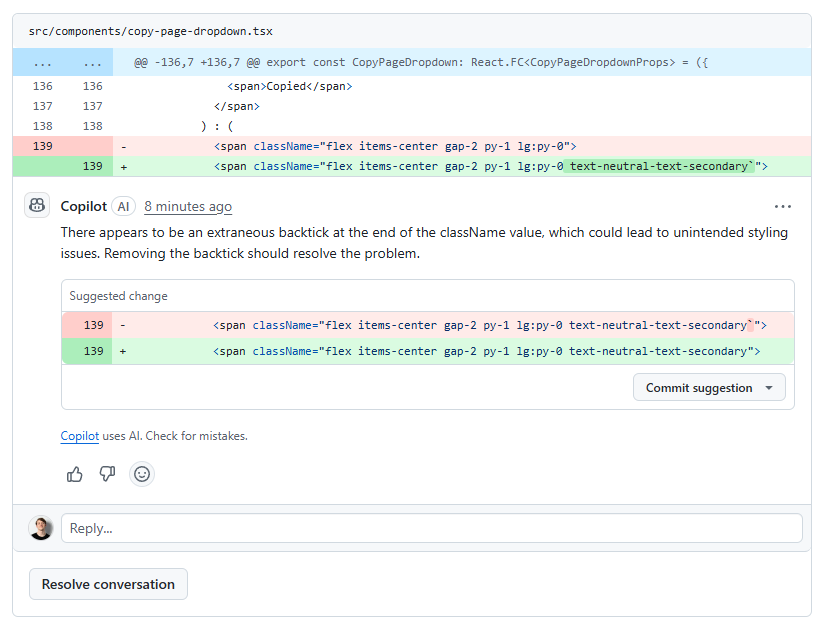
Figure: GitHub Copilot reviewing a pull request for one of the TinaCMS starter kits
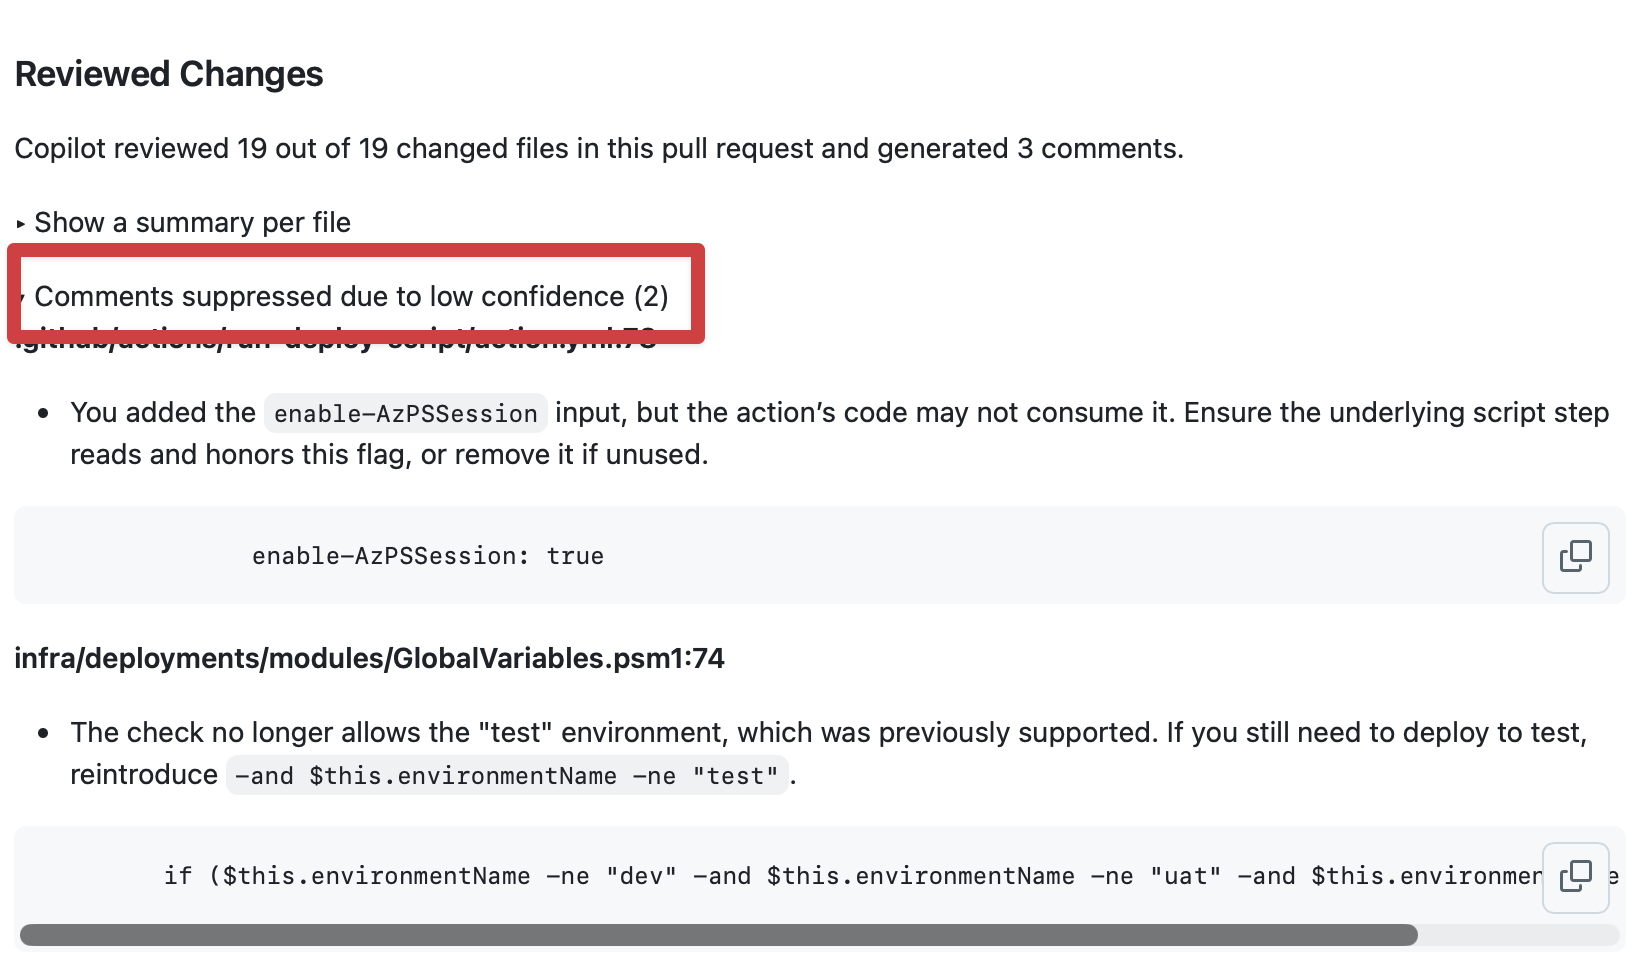
Figure: GitHub Copilot suggestions being suppressed due to potential inaccuracy
In addition to leaving comments on PRs, GitHub Copilot can analyse the changes made by the developer and generate a useful description.
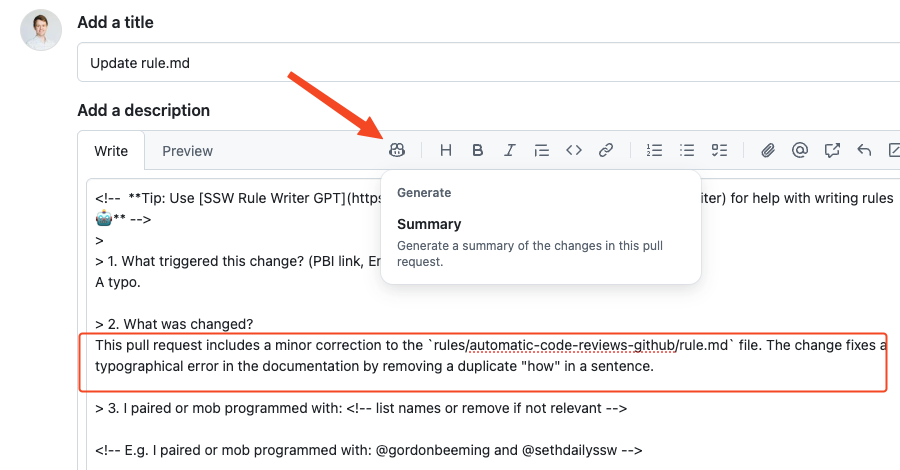
Figure: PR description suggested by GitHub copilot
GitHub Copilot can also be given specific instructions to follow when reviewing PRs. To set this up you can place custom instructions inside of a
.github/copilot-instructions.mdfile.// .github/copilot-instructions.mdWhen performing a code review, please finalize your review by saying "But what do I know, I'm just Cleverbot 2.0"Figure: A set of custom instructions for GitHub Copilot to use when reviewing Pull Requests
For information about setting up automated code reviews using GitHub copilot refer to GitHub's Documentation.
Popular alternatives
Cursor's BugBot
Cursor's BugBot allows you to configure automatic code reviews for a specific repo within Cursor. If you're happy with the suggestions that Cursor has made you can click the "Fix in Cursor" button at the bottom of its comments to apply the fix in your Cursor IDE. In most cases BugBot requires a paid subscription. For more information, refer to Cursor's documentation.
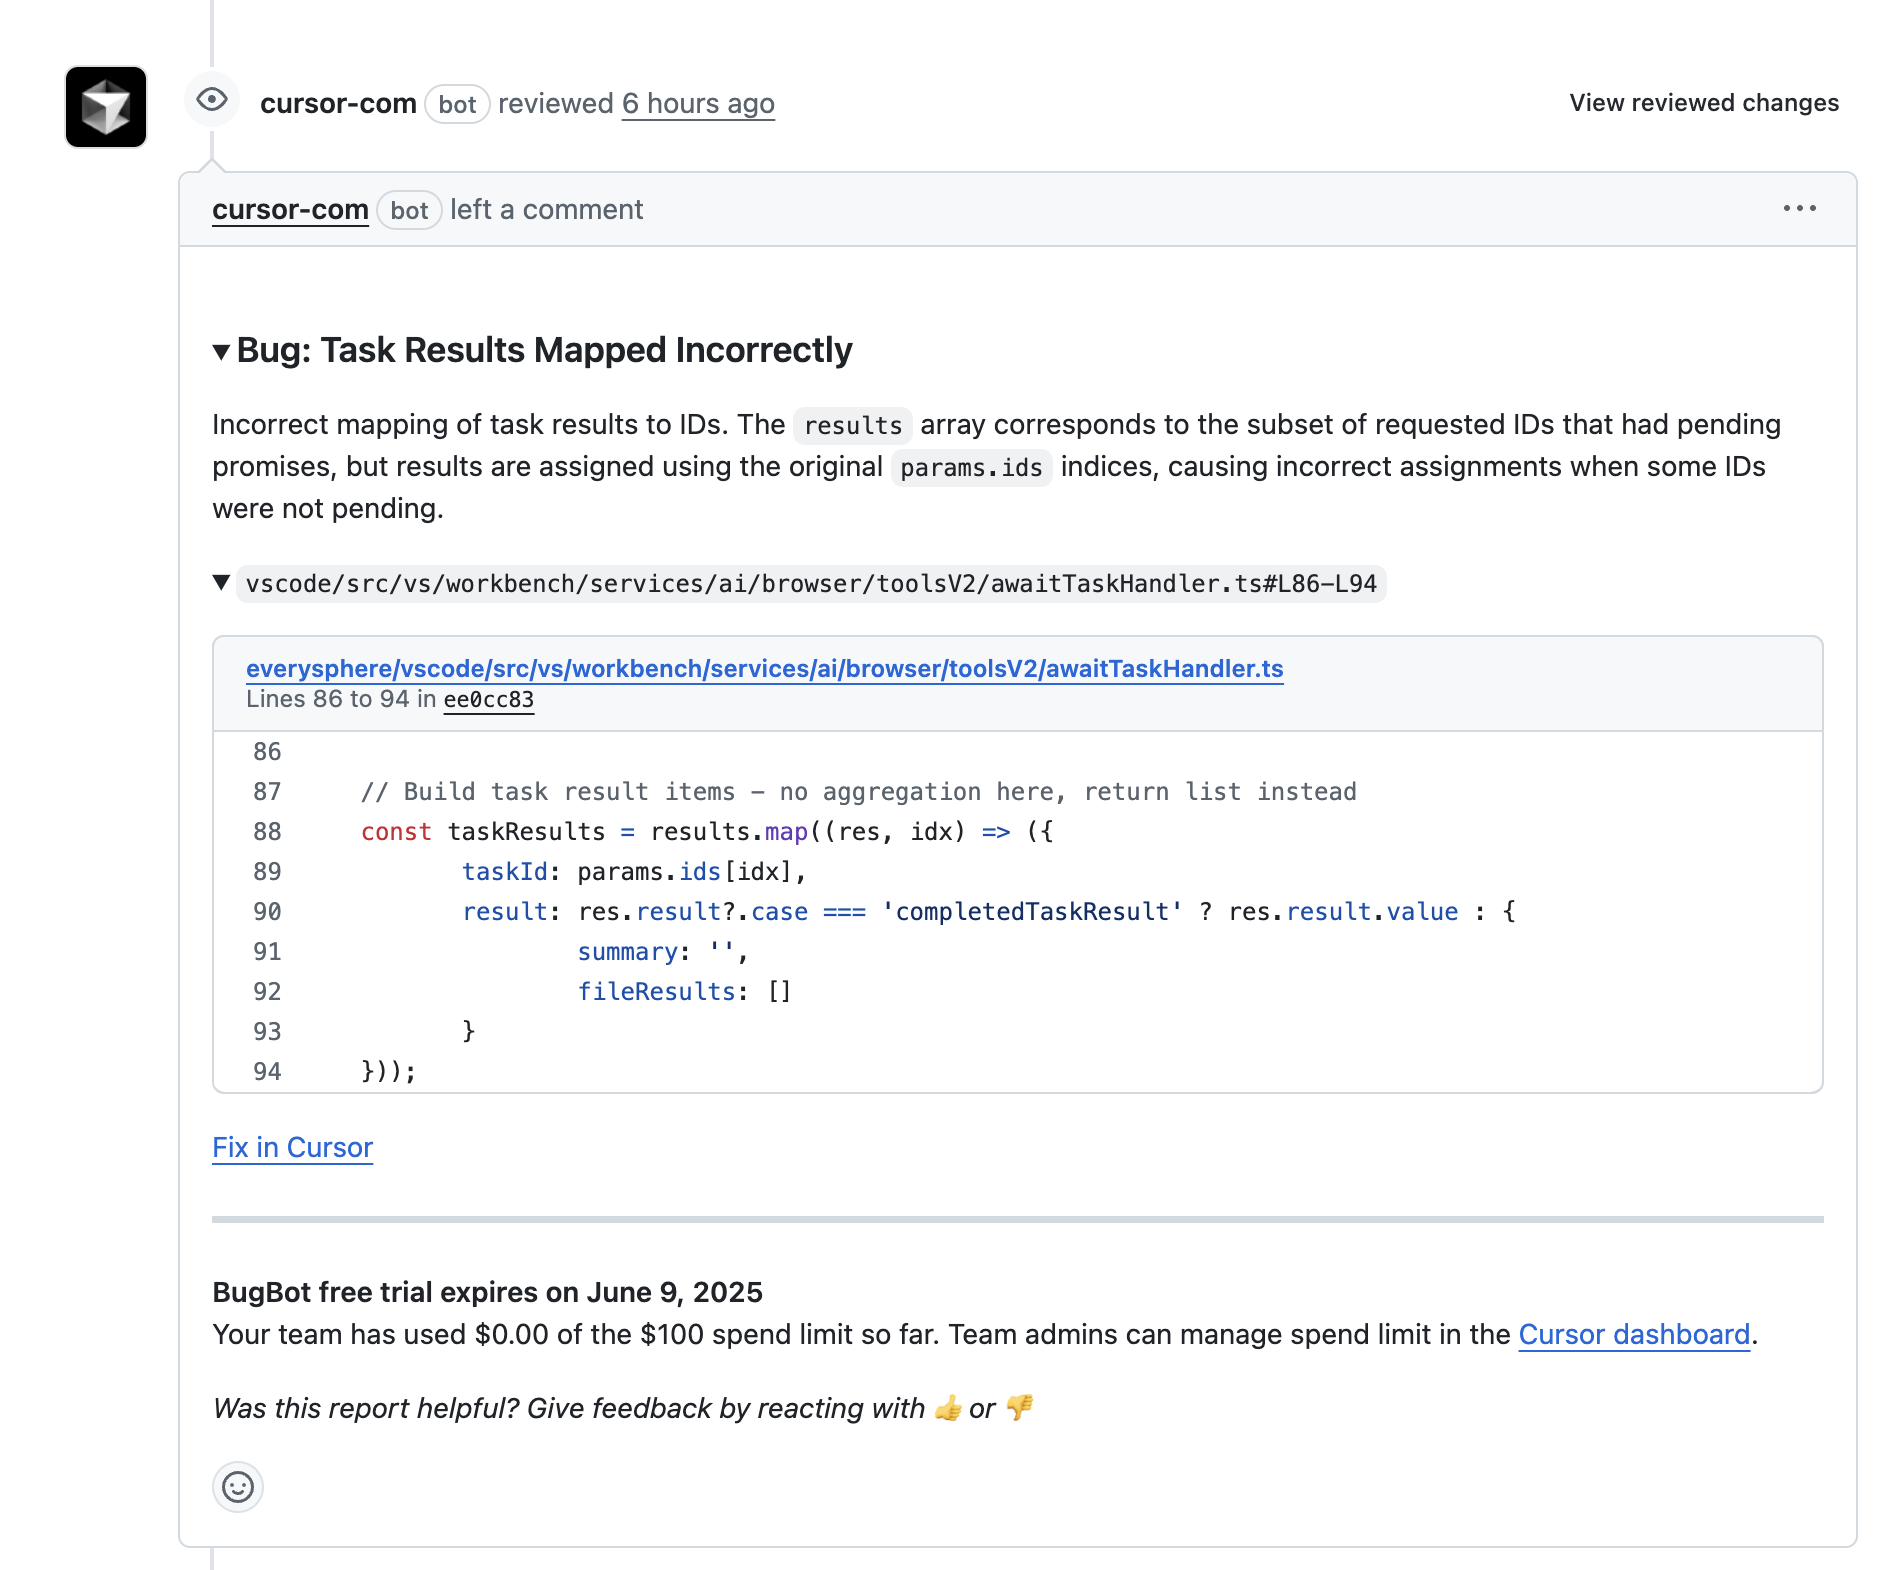
Figure: Cursor's BugBot leaving a comment on a PR
CodeRabbit
CodeRabbit works with VS Code as well as all of its forks (including Cursor) using an IDE Extension. Using the extension, developers can request code reviews before creating a PR. Similar to Cursor and GitHub Copilot, CodeRabbit can review PRs on GitHub. It comes with a generous 14 day trial.
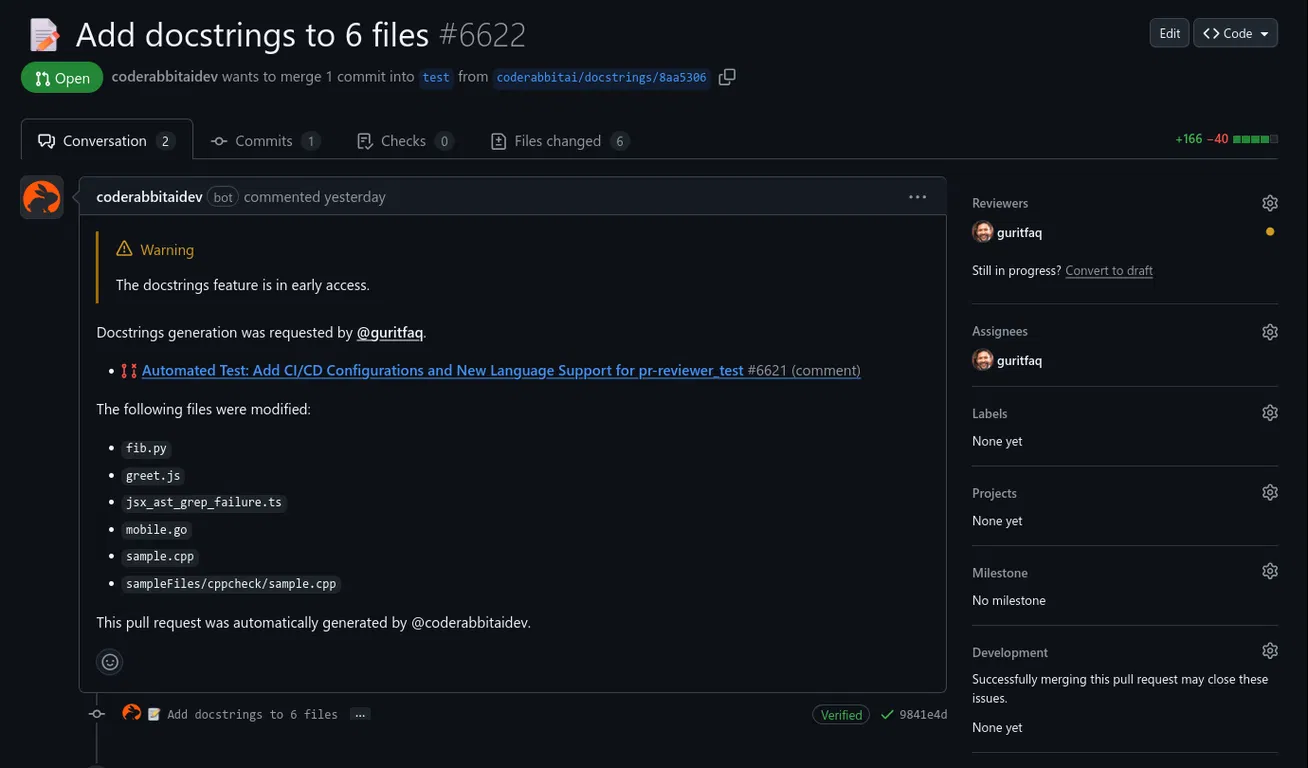
Figure: CodeRabbit leaving a comment on a PR
Do you know how to handle errors in Raygun?
<introEmbed body={<> Your team should always be ensuring that the health of the application is continually improving. The best way to do that is to check the exceptions that are being logged in the production application. Every morning, fix the most serious bug logged over the last week. After it is fixed then email yesterday's application health to the Product Owner. </>} /> There's traditional error logging software like Log4Net or Elmah, but they just give you a wall of errors that are duplicated and don't give you the ability to mark anything as complete. You'll need to manually clear out the errors and move them into your task tracking system (Azure DevOps/VisualStudio.com). This is where RayGun or Application Insights comes into the picture. RayGun gives you the following features: - Grouping exceptions - Ignoring/filtering exceptions - Triaging exceptions (mark them as resolved) - Integrations to TFS/VisualStudio.com to create a Bug, Slack - Tracking the exceptions to a deployment - See which errors are occurring the most often <imageEmbed alt="Image" size="large" showBorder={false} figureEmbed={{ preset: "badExample", figure: 'Bad example - Elmah gives you a wall of exceptions and no way to flag exceptions as completed', shouldDisplay: true }} src="/uploads/rules/how-to-handle-errors-in-raygun/elmah.gif" /> <emailEmbed from="" to="Adam" cc="" bcc="" subject="Raygun Health Check for TimePro" body={<> ## Hi Adam Please find below the Raygun Health Check for TimePro: <imageEmbed alt="Image" size="large" showBorder={false} figureEmbed={{ preset: "default", figure: 'Raygun health check for TimePro in the past 7 days', shouldDisplay: true }} src="/uploads/rules/how-to-handle-errors-in-raygun/Raygun-health-check-for-TimePro-in-the-past-7-days.jpg" /> <imageEmbed alt="Image" size="large" showBorder={false} figureEmbed={{ preset: "default", figure: 'Resolved issues in the past 7 days', shouldDisplay: true }} src="/uploads/rules/how-to-handle-errors-in-raygun/2.png" /> <imageEmbed alt="Image" size="large" showBorder={false} figureEmbed={{ preset: "default", figure: 'The next issue to be worked on', shouldDisplay: true }} src="/uploads/rules/how-to-handle-errors-in-raygun/3.jpg" /> < This email is as per [https://ssw.com.au/rules/how-to-handle-errors-in-raygun](/how-to-handle-errors-in-raygun) > </>} figureEmbed={{ preset: "goodExample", figure: "Good example - Email with Raygun application health report", shouldDisplay: true }} />Do you do exploratory testing?
Use Microsoft's Test & Feedback extension to perform exploratory tests on web apps directly from the browser.
Capture screenshots (and even videos), annotate them and submit bugs into Azure DevOps as you explore your web app - all directly from the Chrome browser (Edge and Firefox are also supported).
Test on any platform (Windows, Mac or Linux) on different devices - without the need for pre-defined test cases or test steps.
Video: Ravi walks Adam through the exploratory testing extension - You can also [watch on SSW TV](http://tv.ssw.com/6664/exploratory-testing-extension-for-visual-studio-adam-cogans-interview-with-ravi-shanker)Video: Ravi Shanker and Adam Cogan talk about the test improvements in Azure DevOps and the Chrome Test & Feedback extension - You can also [watch on SSW TV](https://tv.ssw.com/6873/vs-test-feedback-chrome-extension-with-product-owner-ravi-shanker-microsoft-seattle-2017)- Go to Visual Studio Marketplace and install "Test & Feedback":
Figure: Microsoft Test & Feedback (was Exploratory Testing) extension
- Click "Add to Chrome" to add the extension to the browser on your computer:
Figure: Chrome Web Store page for Test & Feedback extension
- Go to Chrome.
- Start a session by clicking on the Chrome extension and then click start a session:
Figure: Chrome extension icon
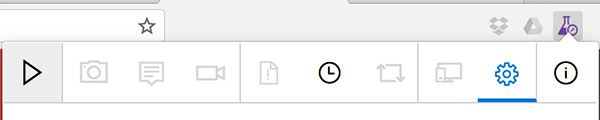
Figure: Test & Feedback "Start session" button
Note: See Azure DevOps - Explore work items with the Test & Feedback extension for detailed information about the use of this extension alongside Azure DevOps.
Do you know how to report bugs and give suggestions?
<introEmbed body={<> When reporting bugs or providing product feedback, it’s important to include as much relevant detail as possible. Make sure it reaches the right people through the right channel - ideally the product backlog, or email if needed. A well-written report saves time and avoids frustration for both you and the developers. </>} /> ## ✅ Use YakShaver The best way to report bugs or share feedback is by using [YakShaver](https://yakshaver.ai/). YakShaver is a smart tool that simplifies how you report issues and give feedback. Instead of spending time writing a detailed report or figuring out who to send it to, you just record a quick video and YakShaver handles the rest. Using AI, YakShaver analyzes what you've said and automatically routes the issue to the right person. This means you don’t have to worry about choosing the right backlog, tagging the right team member, or following up to make sure it landed in the right place. It speeds up communication, reduces misunderstandings, and allows everyone to focus on solving the real issue instead of getting bogged down by process. <youtubeEmbed url="https://www.youtube.com/shorts/0TPo98R1tnI" description="Video: What is YakShaver? | Ulysses Maclaren (1 min)" /> --- ## ❌ Do it manually If you can’t use YakShaver for some reason, follow these 8 tips to do it right manually: * [Tip #1: Draft your bug with enough details](#tip-1-draft-your-bug-with-enough-details) * [Tip #2: Draft your suggestion with the complaint and what you expect to see](#tip-2-draft-your-suggestion-with-the-complaint-and-what-you-expect-to-see) * [Tip #3: Should you send this to the Product Owner or the Tech Lead?](#tip-3-should-you-send-this-to-the-product-owner-or-the-tech-lead) * [Tip #4: Should you email or put it in the backlog?](#tip-4-should-you-email-or-put-it-in-the-backlog) * [Tip #5: Do you make it easy to find all the backlog in your company?](#tip-5-do-you-make-it-easy-to-find-all-the-backlog-in-your-company) * [Tip #6: Make sure when using backlog, the Product Owner will still get an email](#tip-6-make-sure-when-using-backlog-the-product-owner-will-still-get-an-email) * [Tip #7: Separate PBIs](#tip-7-separate-pbis) * [Tip #8: Use emojis and prefixes for PBI/Issues titles, or email subjects](#tip-8-use-emojis-and-prefixes-for-pbiissues-titles-or-email-subjects) <imageEmbed alt="Image" size="large" showBorder={false} figureEmbed={{ preset: "default", figure: 'Making the Product Backlog the main source of tasks', shouldDisplay: true }} src="/uploads/rules/report-bugs-and-suggestions/report-bugs-and-suggestions.png" /> ### Tip #1: Draft your bug with enough details Make sure you always explain and give as many details as you can of how you got an error or a bad experience. Detailed and useful descriptions can make finding the solution quicker and easier. The goal is to include enough details so the developer can focus on the development work more rather than trying to figure out what the feature requirements or bugs are. Things to include: * Steps to reproduce the error * OS and browser details * Screenshots\ **💡 Tip:** Copy and paste the text for searchability * Video for more complex bugs (more info below) Learn more: * [Do you have a clear definition of a bug?](/definition-of-a-bug) * [How to produce a good bug report?](https://www.boxuk.com/insight/what-makes-a-good-bug-report) <emailEmbed from="" to="{{ SUPPORT EMAIL }}" cc="" bcc="" subject="Your software" body={<> ## Hi I'm having a problem with your software. When I run it, it says something about registration and then exists. Can you tell how to fix this? Thanks </>} figureEmbed={{ preset: "badExample", figure: "Bad example - This email isn't going to help the developer much - it is vague, has no screen capture or other details to help reproducing the error", shouldDisplay: true }} /> <emailEmbed from="" to="{{ SUPPORT EMAIL }}" cc="" bcc="" subject="🐛 BUG - PerformancePro - Error on startup" body={<> ## Hi team I'm having a problem with your PerformancePro software. When I run it, this is what happens: 1. Run the application from Start | Programs 2. Access opens 3. I get this error:  Here is the transcription for searchability: > An embedded page at chrome-extension://laookkfknpbbblfpciffpaejjkokdgca says: > Could not find resource: longtail performance counter. > Prevent this page from creating additional dialogs. I have the latest version of all my software. I am running Windows 10 and Office365. Can you please investigate and let me know how to proceed? Thanks </>} figureEmbed={{ preset: "goodExample", figure: "Good example - This email includes the product name and version, the category of the issue (BUG), a screen capture, and informs the user's system", shouldDisplay: true }} /> #### Functional Bug template When possible, a great template to follow is the [Functional Bug template](https://github.com/aspnet/Home/wiki/Functional-bug-template) from the ASP.NET open-source project. Spending time to provide as much detail as possible, by ensuring you have the 3 critical components: * Steps to reproduce * Expected outcome * Actual outcome <emailEmbed from="" to="Danny" cc="" bcc="" subject="SSW TV" body={<> ## Hi Danny Where is SSW TV on the navigation? Adam </>} figureEmbed={{ preset: "badExample", figure: "Bad example - Lack of details", shouldDisplay: true }} /> <emailEmbed from="" to="Danny" cc="" bcc="" subject="SSW Website - Can't find SSW TV link" body={<> ## Hi Danny I've searched the SSW website and can't find a link to SSW TV. 1. Navigated to ssw.com.au 2. Scrolling though home page. Nothing. 3. Checked the menu at the top. Nothing. 4. About Us? Nope. 5. Services? Nope. 6. Products and Support? Nope. 7. Training? Nope. 8. User Group? Nope. 9. Me, thinking... "OK. Now where? Most likely, the SSW company description will list it..." Navigates to About Us... scrolling down... Nothing. 10. Me, thinking... "OK. Weird. Let's go back." Me, goes back to homepage. 11. Me, thinking... "Is there a site map?" Scrolls to bottom of page. Clicks sitemap link. Nope. 12. Me, thinking... "Ctrl+F for TV? Nope." ### Expected result When I navigate to ssw.com.au, I should see at the top of the page clear link to click on "CHECK OUT SSW TV!" ### Actual result Couldn't find a link on the page. 1. Can you help users to get to SSW TV website from SSW website Adam </>} figureEmbed={{ preset: "goodExample", figure: "Good example - We can easily identify more the one way to improve the UX and there's a clear suggestion to action", shouldDisplay: true }} /> #### Make it extra clear with videos Better than a good textual description of a bug report is a screen recording. This should be followed for a more detailed report. Use [Snagit](http://www.techsmith.com/snagit.html) or [Camtasia](/production-do-you-know-how-to-start-recording-with-camtasia) to record your screen. <youtubeEmbed url="https://www.youtube.com/embed/y9vsGY1hYN0" description="" /> <figureEmbed figureEmbed={{ preset: "goodExample", figure: 'Video: Good example - Recording bug reports in a video can make the issue clearer to see (1 min)', shouldDisplay: true } } /> Recording a stepped user flow of actions that walk through through an issue is another excellent way of reporting a problem that is easily understood and reproducible. There are many tools you can use to make recording these steps easy, for example [Steps Recorder](https://support.microsoft.com/en-us/windows/record-steps-to-reproduce-a-problem-46582a9b-620f-2e36-00c9-04e25d784e47) which is built in to Windows, or [Microsoft's Test & Feedback extension](https://learn.microsoft.com/en-us/azure/devops/test/perform-exploratory-tests?view=azure-devops#install-the-extension&WT.mc_id=AZ-MVP-33518) for Chrome, Edge and Firefox. See our rules for setting up and using these tools at [Do you use Problem Steps Recorder?](/do-you-use-problem-steps-recorder/) and [Do you do exploratory testing?](/do-you-do-exploratory-testing/) <imageEmbed alt="Image" size="large" showBorder={false} figureEmbed={{ preset: "goodExample", figure: 'Good example - Using a tool to record steps replicating an issue is a great and simple way to report a problem that\'s easy for a developer to understand and reproduce', shouldDisplay: true }} src="/uploads/rules/report-bugs-and-suggestions/psr3.png" /> ### Tip #2: Draft your suggestion with the complaint and what you expect to see Define all the requirements as per [Do your User Stories include Acceptance Criteria?](/acceptance-criteria) Better than a good textual description of a suggestion request is a screen recording. This should be followed for a more detailed report. Use [Snagit](http://www.techsmith.com/snagit.html) or [Camtasia](/production-do-you-know-how-to-start-recording-with-camtasia) to record your screen. <youtubeEmbed url="https://www.youtube.com/embed/VDZSfHJ7GNU" description="" /> <figureEmbed figureEmbed={{ preset: "goodExample", figure: 'Video: Good example - Giving suggestion requests via video (5 min)', shouldDisplay: true } } /> ### Tip #3: Should you send this to the Product Owner or the Tech Lead? It depends on the team, but often the Product Owner is busy. If you know the Tech Lead and your suggestion is obviously a good one, then you should email the Tech Leader and Cc the Product Owner. The Product Owner can always reply if they don’t like the suggestion. If you are unclear use IM to ask, but remember [the golden rule to not send tasks on Teams](/important-chats-should-be-in-an-email). <asideEmbed variant="greybox" body={<> **For a bug email:**\   **To:** Tech Lead\   **Cc:** Product Owner\   **Subject:** Bug - {{ SUMMARY OF BUG }} **For a new feature email:**\   **To:** Tech Lead\   **Cc:** Product Owner\   **Subject:** Suggestion - {{ SUMMARY OF SUGGESTION }} </>} figureEmbed={{ preset: "default", figure: 'XXX', shouldDisplay: false }} /> ### Tip #4: Should you email or put it in the backlog? Always go for backlog if you have access to a backlog management system, otherwise email relevant people. <asideEmbed variant="info" body={<> You would only Cc group emails - such as `all@northwind.com.au` - when a **greater visibility** is required. </>} figureEmbed={{ preset: "default", figure: 'XXX', shouldDisplay: false }} /> ### Tip #5: Make it easy to find backlogs within your company It is recommended to keep track of active project backlogs on the company intranet, while also including the Product Owner and Tech Lead contact information, coupled with a link to the Teams channel of that project. <imageEmbed alt="Image" size="large" showBorder={false} figureEmbed={{ preset: "default", figure: 'An intranet page with links to projects’ backlog to make it easy for everyone to find. Note some projects have more than 1 backlog.', shouldDisplay: true }} src="/uploads/rules/report-bugs-and-suggestions/do-you-know-how-to-report-bugs-and-give-suggestions.png" /> ### Tip #6: Make sure when using backlog, the Product Owner will still get an email Create an Issue/PBI and @mention relevant people (GitHub and Azure DevOps will generate a nicely formatted email) See rules on [Do you know when you use @ mentions in a PBI?](/when-you-use-mentions-in-a-pbi) ### Tip #7: Separate PBIs If they are all related to one area, then you could consider putting them together. Otherwise don’t bunch them up. See rules on [Do you send tasks one email at a time?](/do-you-send-tasks-one-email-at-a-time) ### Tip #8: Use emojis and prefixes for PBI/Issues titles, or email subjects When you create a bug/suggestion to a backlog, it's a good idea to add emoji in the title. Not only does it look nicer, but people can look at the item and take in the necessary information quickly. This means that anyone looking at the backlog can glean its nature at a glance, rather than having to read each item to know what category it is (5 bugs, 2 features, etc). Examples: * **🐛 Bug - Calendar is not showing on iOS devices** * **✨ Feature - Add 'Back to menu' item to top navigation** Check out the rule on [which emojis to use in Scrum](/which-emojis-to-use-in-scrum). <asideEmbed variant="info" body={<> **Note:** [GitHub Issue Templates](/github-issue-templates) can help you with this. </>} figureEmbed={{ preset: "default", figure: 'XXX', shouldDisplay: false }} />Do you use the best Code Analysis tools?
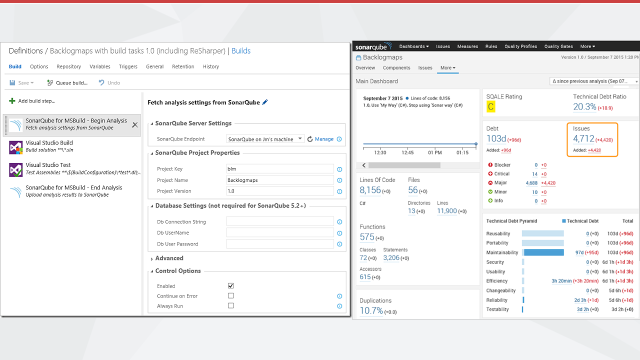
<introEmbed
  body={<>
Whenever you are writing code, you should always make sure it conforms to your team's standards. If everyone is following the same set of rules; someone else’s code will look more familiar and more like your code - ultimately easier to work with.

No matter how good a coder you are, you will always miss things from time to time, so it's a really good idea to have a tool that automatically scans your code and reports on what you need to change in order to improve it.
  </>}
/>
Visual Studio has a great Code Analysis tool to help you look for problems in your code. Combine this with Jetbrains' ReSharper and your code will be smell free.


<imageEmbed
  alt="Image"
  size="large"
  showBorder={false}
  figureEmbed={{
    preset: "default",
    figure: 'You wouldn\'t play cricket without protective gear and you shouldn\'t code without protective tools',
    shouldDisplay: true
  }}
  src="/uploads/rules/do-you-use-the-best-code-analysis-tools/CricketHelmet.jpg"
/>

The levels of protection are:

### Level 1

Get ReSharper to green on each file you touch. You want the files you work on to be left better than when you started. See [Do you follow the boyscout rule?](/follow-boy-scout-rule/)

You can run through a file and tidy it very quickly if you know 2 great keyboard shortcuts:

* Alt + [Page Down/Page Up] : Next/Previous Resharper Error / Warning
* Alt + Enter: Smart refactoring suggestions


<imageEmbed
  alt="Image"
  size="large"
  showBorder={false}
  figureEmbed={{
    preset: "default",
    figure: 'ReSharper will show Orange when it detects that there is code that could be improved',
    shouldDisplay: true
  }}
  src="/uploads/rules/do-you-use-the-best-code-analysis-tools/48bc81_image001.png"
/>


<imageEmbed
  alt="Image"
  size="large"
  showBorder={false}
  figureEmbed={{
    preset: "default",
    figure: 'ReSharper will show green when all code is tidy',
    shouldDisplay: true
  }}
  src="/uploads/rules/do-you-use-the-best-code-analysis-tools/ReSharper-green.png"
/>

### Level 2

Use [SSW CodeAuditor](https://codeauditor.com).


<imageEmbed
  alt="Image"
  size="large"
  showBorder={false}
  figureEmbed={{
    preset: "default",
    figure: 'CodeAuditor shows a lot of warnings in this test project',
    shouldDisplay: true
  }}
  src="/uploads/rules/do-you-use-the-best-code-analysis-tools/CodeAuditor.png"
/>

**Note:** Document any rules you've turned off.

### Level 3

Use StyleCop to check that your code has consistent style and formatting.


<imageEmbed
  alt="Image"
  size="large"
  showBorder={false}
  figureEmbed={{
    preset: "default",
    figure: 'StyleCop shows a lot of warnings in this test project',
    shouldDisplay: true
  }}
  src="/uploads/rules/do-you-use-the-best-code-analysis-tools/StyleCopInVS2010.png"
/>

### Level 4

Run Code Analysis (was FxCop) with the default settings or ReSharper with Code Analysis turned on.


<imageEmbed
  alt="Image"
  size="large"
  showBorder={false}
  figureEmbed={{
    preset: "default",
    figure: 'Run Code Analysis in Visual Studio',
    shouldDisplay: true
  }}
  src="/uploads/rules/do-you-use-the-best-code-analysis-tools/CodeAnalysisVS11.png"
/>


<imageEmbed
  alt="Image"
  size="large"
  showBorder={false}
  figureEmbed={{
    preset: "default",
    figure: 'The Code Analysis results indicate there are 17 items that need fixing',
    shouldDisplay: true
  }}
  src="/uploads/rules/do-you-use-the-best-code-analysis-tools/codeanalysis.png"
/>

### Level 5

Ratchet up your Code Analysis Rules until you get to 'Microsoft All Rules'.


<imageEmbed
  alt="Image"
  size="large"
  showBorder={false}
  figureEmbed={{
    preset: "default",
    figure: 'Start with the Minimum Recommended Rules, and then ratched up.',
    shouldDisplay: true
  }}
  src="/uploads/rules/do-you-use-the-best-code-analysis-tools/image003.png"
/>

### Level 6

Document any rules you've turned off.

All of these rules allow you to disable rules that you're not concerned about. There's nothing wrong with disabling rules you don't want checked, but you should make it clear to developers why those rules were removed.

Create a **GlobalSuppressions.cs** file in your project with the rules that have been turned off and why.


<imageEmbed
  alt="Image"
  size="large"
  showBorder={false}
  figureEmbed={{
    preset: "default",
    figure: 'The suppressions file tells Code Analysis which rules it should disable for specific code blocks',
    shouldDisplay: true
  }}
  src="/uploads/rules/do-you-use-the-best-code-analysis-tools/suppressions-file.png"
/>

**More Information:** [Do you make instructions at the beginning of a project and improve them gradually?](/do-you-make-instructions-at-the-beginning-of-a-project-and-improve-them-gradually) and <https://docs.microsoft.com/en-us/visualstudio/code-quality/in-source-suppression-overview?WT.mc_id=DT-MVP-33518>

### Level 7

The gold standard is to use [SonarQube](https://www.sonarqube.org/), which gives you the code analysis that the previous levels give you as wells as the ability to analyze technical debt and to see which code changes had the most impact to technical debt


<imageEmbed
  alt="Image"
  size="large"
  showBorder={false}
  figureEmbed={{
    preset: "default",
    figure: 'SonarQube workflow with Visual Studio and Azure DevOps',
    shouldDisplay: true
  }}
  src="/uploads/rules/do-you-use-the-best-code-analysis-tools/2016-06-08_12-59-38.png"
/>


<imageEmbed
  alt="Image"
  size="large"
  showBorder={false}
  figureEmbed={{
    preset: "default",
    figure: 'SonarQube gives you the changes in code analysis results between each check-in',
    shouldDisplay: true
  }}
  src="/uploads/rules/do-you-use-the-best-code-analysis-tools/2016-06-08_12-59-53.png"
/>
Do you look for Code Coverage?
Code Coverage shows how much of your code is covered by tests and can be a useful tool for showing how effective your unit testing strategy is. However, it should be looked at with caution.
- You should focus more on the quality and less on the quantity of tests
- You should write tests for fragile code first and not waste time testing trivial methods
- Remember the 80-20 rule - very high test coverage is a noble goal, but there are diminishing returns
- If you're modifying code, write the test first, then change the code, then run the test to make sure it passes (aka red-green-refactor). Tip: This is made very easy by the "Live Unit Testing" feature in Visual Studio - see Do you use Live Unit Testing to see code coverage?
- You should run your tests regularly (see Do you follow a Test Driven Process?) and, ideally, the tests will be part of your deployment pipeline
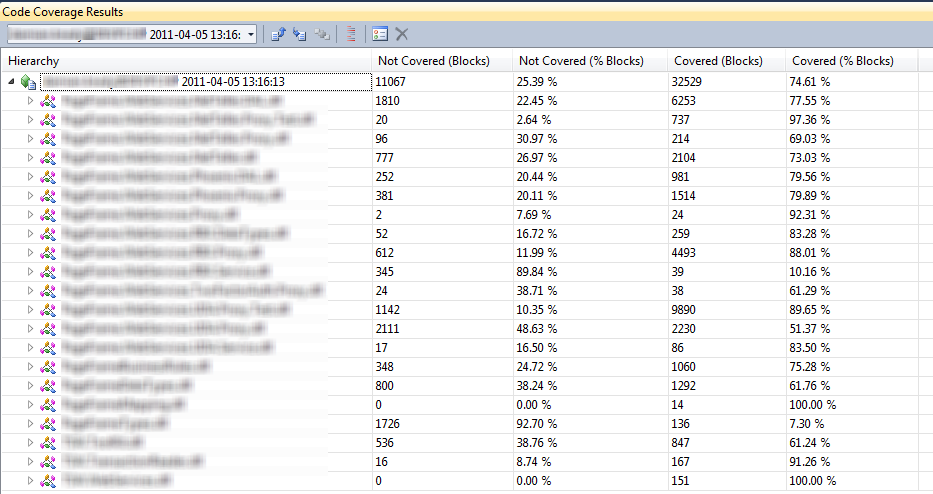
Figure: Code Coverage metrics in Visual Studio. This solution has high code coverage (around 80% on average)
Tip: To make sure your unit test coverage never decreases, make use of tools such as SonarQube and GitHub action checks to gate your deployment pipelines on non-decreasing test coverage.
Do you use Slack as part of your DevOps?
Figure: See how Slack can be setup to improve your DevopsWith all these different tools being used to collect information in your application, a developer will frequently need to visit many different sites to get information like:
- Was the last build successful?
- What version is in production?
- What errors are being triggered on the app?
- Is the server running slow?
- What is James working on?
This is where a tool like Slack comes in handy. It can help your team aggregate this information from many separate sources into one dedicated channel for your project. The other benefits also include a new team member instantly having access to the full history of the channel as well so no conversations are lost.
At SSW we integrate Slack with:
- Octopus Deploy
- RayGun.io
- TeamCity
- Visual Studio
Even better, you can create bots in slack to manage things like deployments and updating release notes.
✅ Figure: 
Do you create a Continuous Integration Build for the Solution?
(Before you configure continuous deployment) You need to ensure that the code that you have on the server compiles. A successful CI build without deployment lets you know the solution will compile.
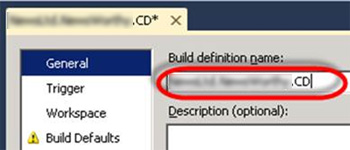
Figure: The Build definition name should include the project name. The reason for this is that builds for all solutions are placed in the same folder, and including the build name makes the Build Drop folder organised
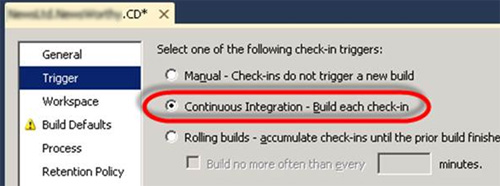
Figure: On the Trigger tab choose Continuous Integration. This ensures that each check-in results in a build
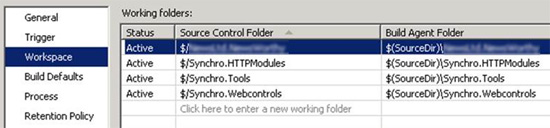
Figure: On the Workspace tab you need to include all source control folders that are required for the build
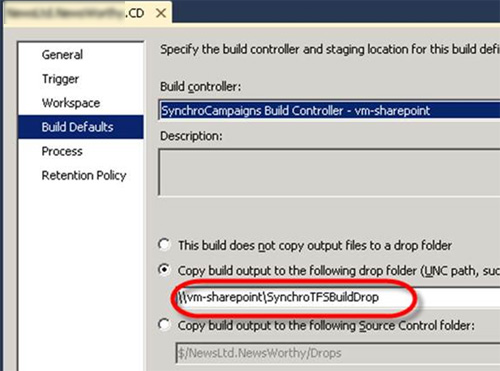
Figure: Enter the path to your Drop Folder (where you drop your builds)
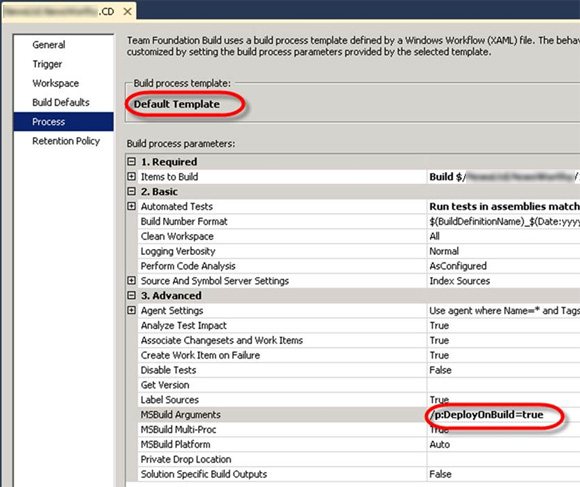
Figure: Choose the Default Build template and enter the DeployOnBuild argument to the MSBuild Arguments parameter of the build template
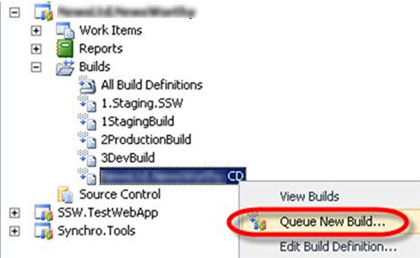
Figure: Queue a build, to ensure our CI build is working correctly
Figure: Before we setup continuous deployment it is important to get a successful basic CI build
Do you publish simple websites directly to Windows Azure from Visual Studio Online?
TFS and Windows Azure work wonderfully together. It only takes a minute to configure continuous deployment from Visual Studio Online (visualstudio.com) to a Windows Azure website or Cloud Service.
This is by far the most simple method to achieve continuous deployment of your websites to Azure. But, if your application is more complicated, or you need to run UI tests as part of your deployment, you should be using Octopus Deploy instead according to the Do you use the best deployment tool rule.
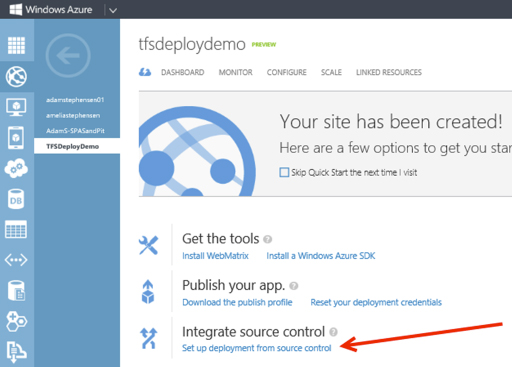
Figure: Setting up deployment from source control is simple from within the Azure portal
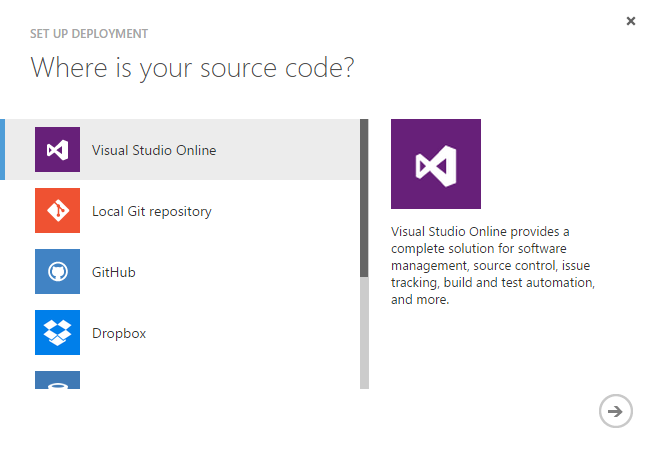
Figure: Deployment is available from a number of different source control repositories
Suggestion to Microsoft: We hope this functionality comes to on-premise TFS and IIS configurations in the next version.
Do you use a Project Portal for your team and client?
When a new developer joins a project, there is often a sea of information that they need to learn right away to be productive. This includes things like who the Product Owner and Scrum Master are, where the backlog is, where staging and production environments are, etc.
Make it easy for the new developer by putting all this information in a central location like the Visual Studio dashboard.
Note: As of July 2025, this feature is missing in GitHub Projects.
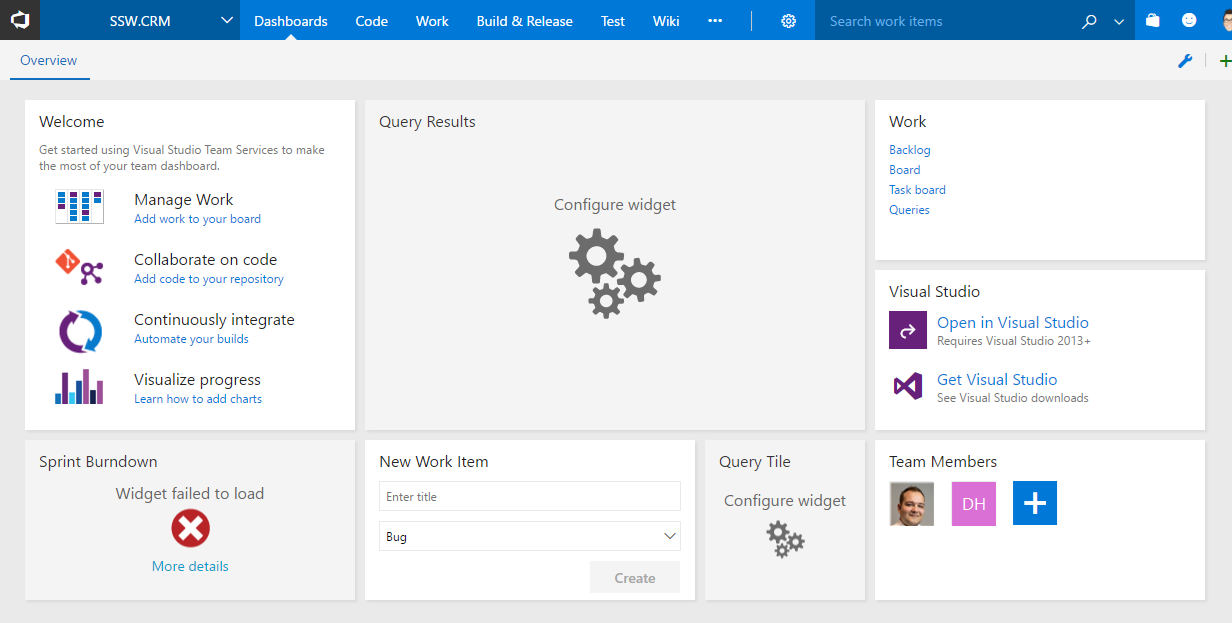
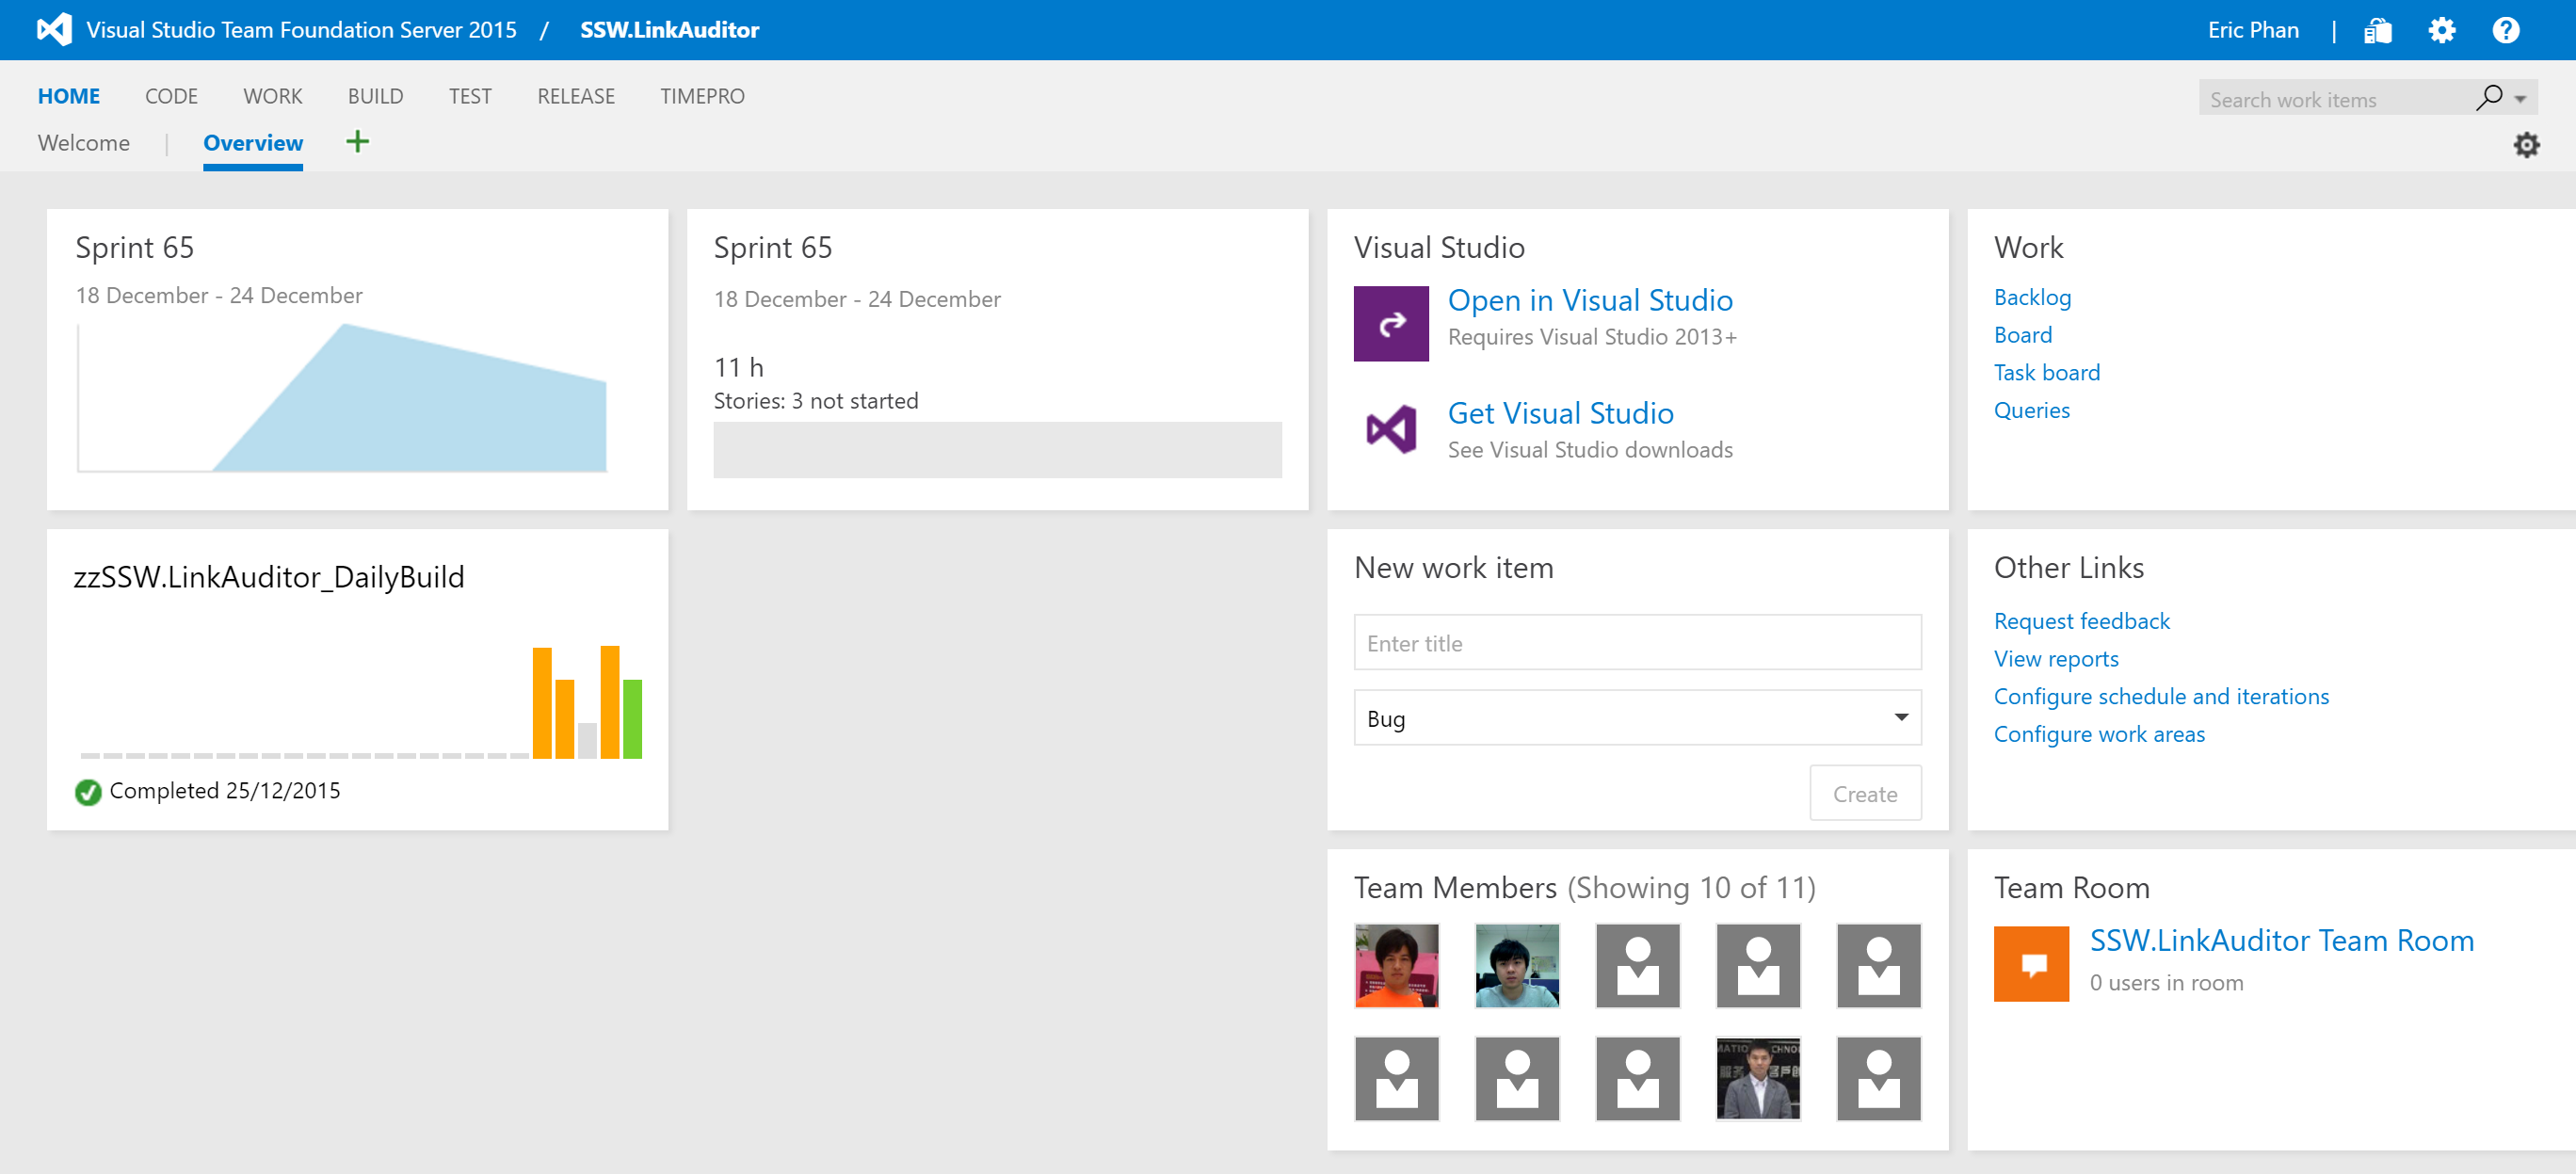
❌ Figure: Bad example - Don't stick with the default dashboard, it's almost useless
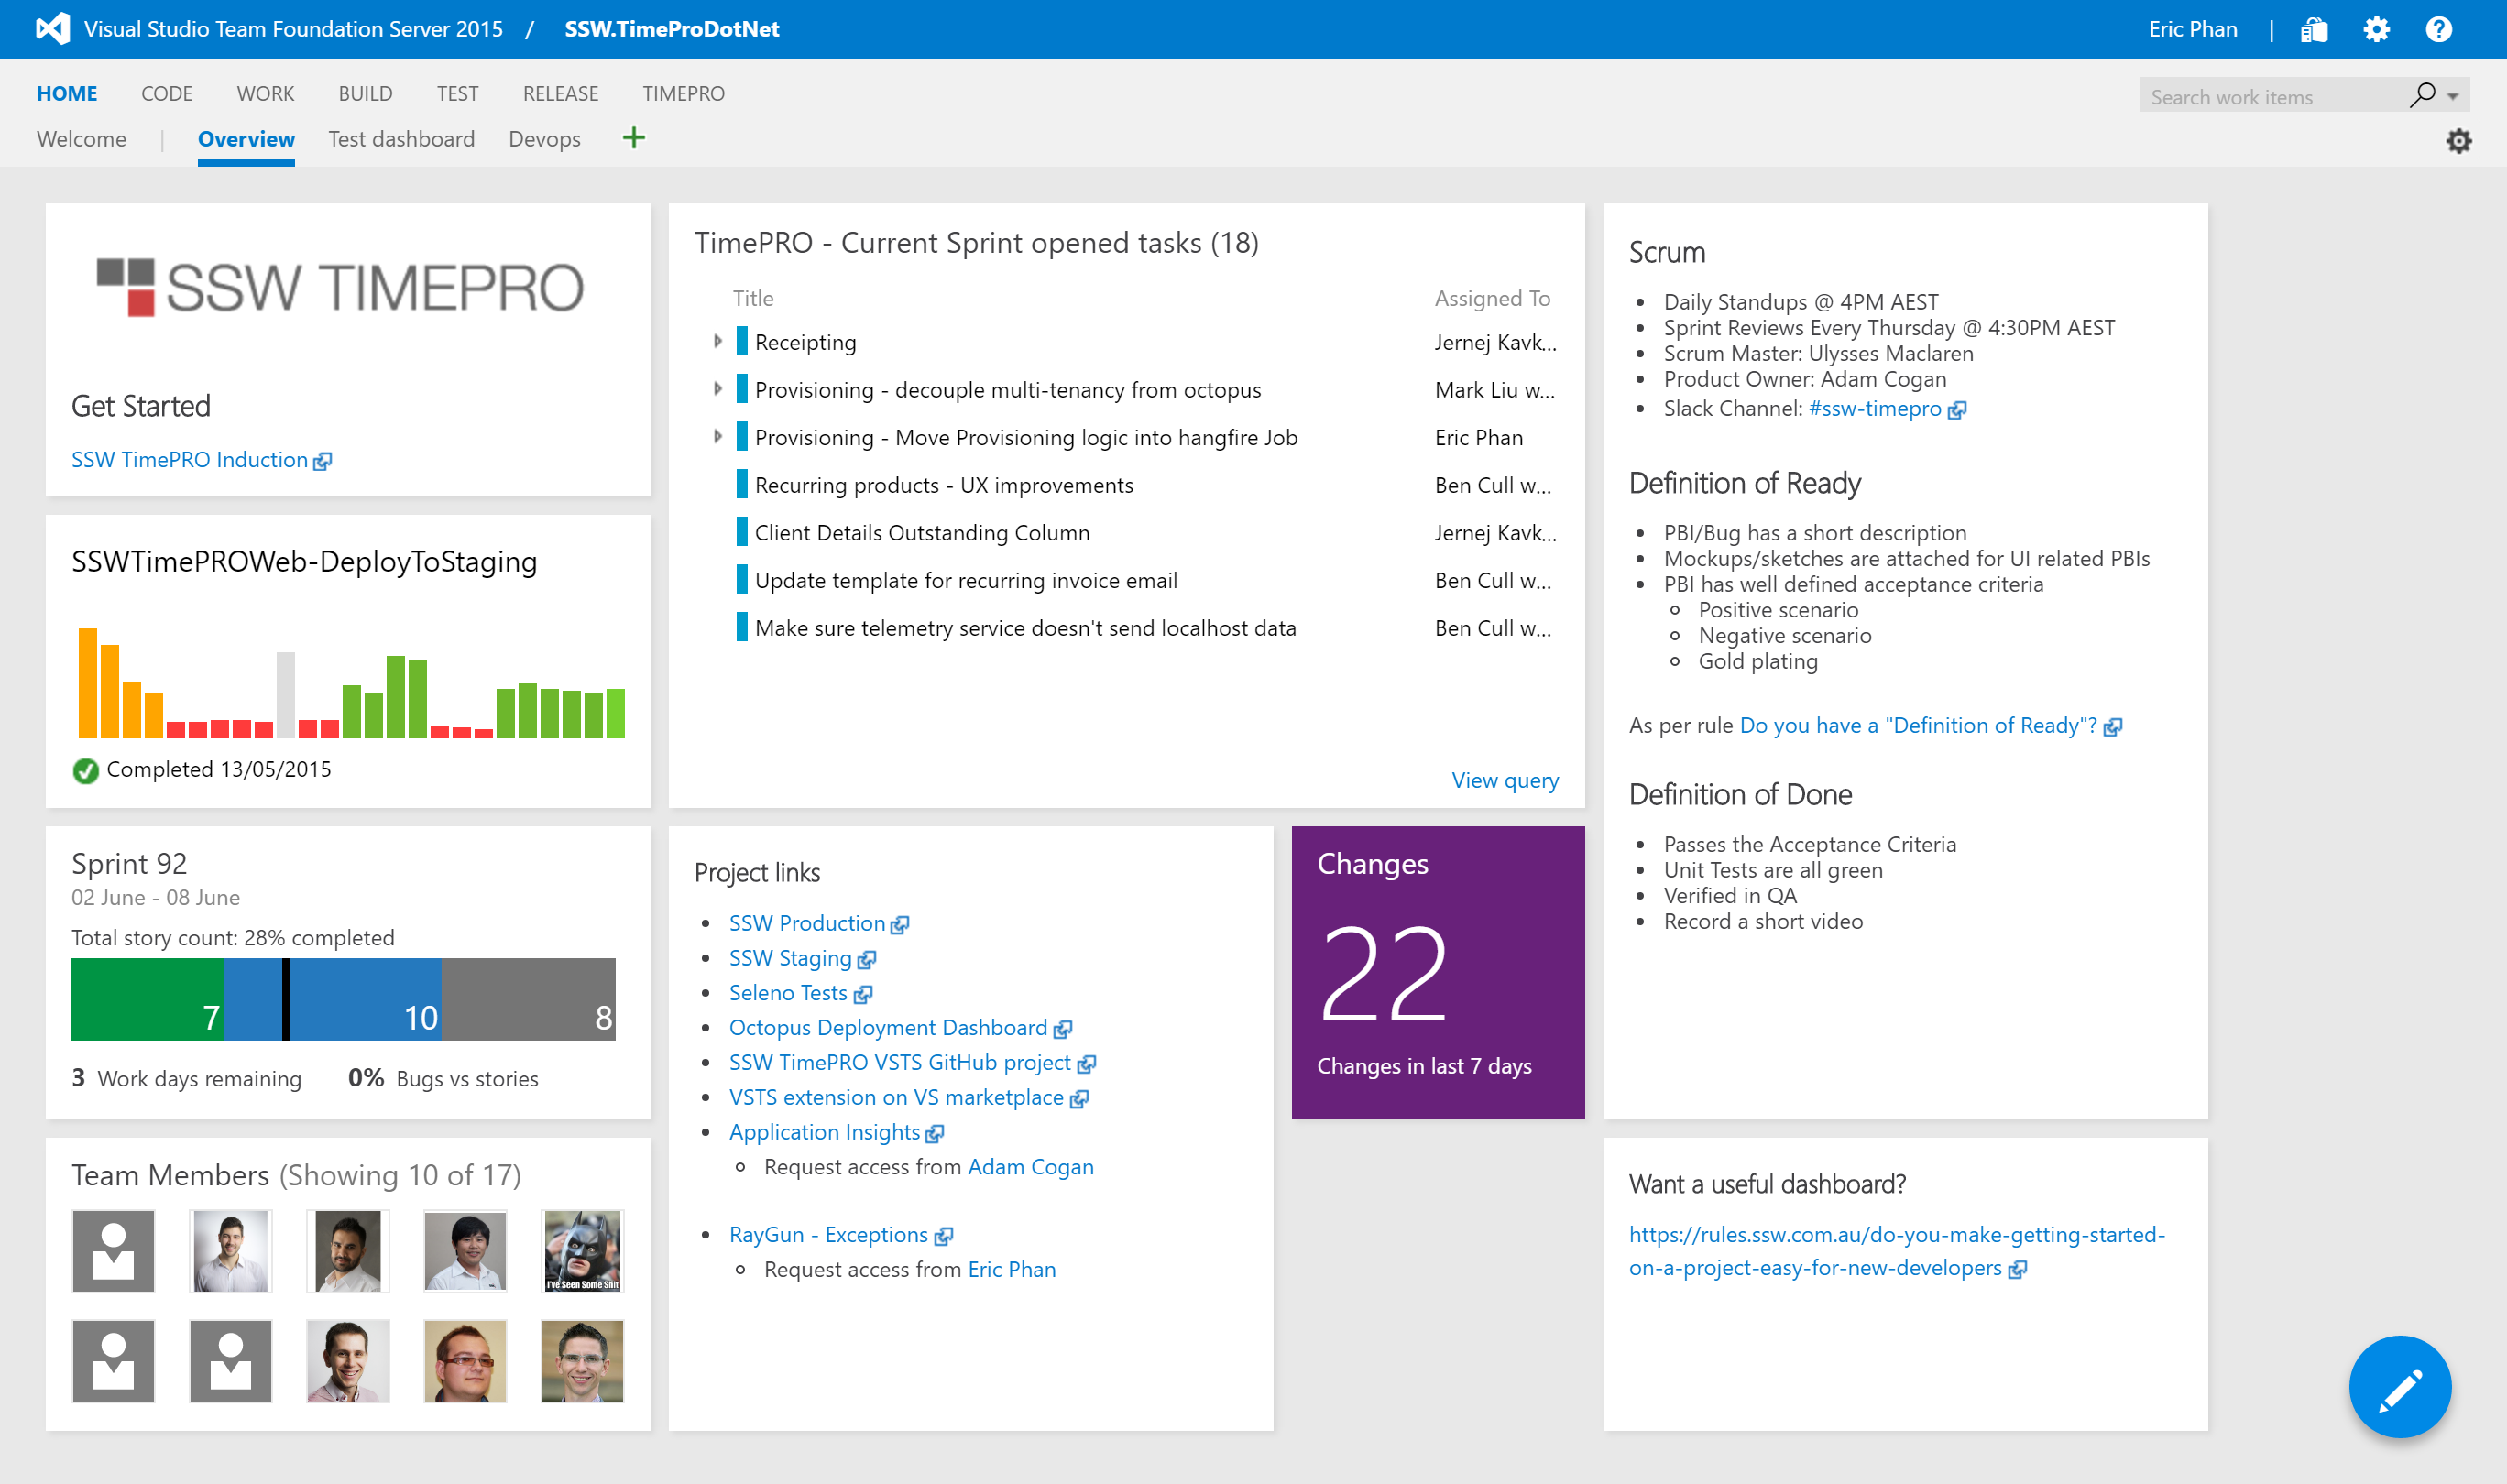
✅ Figure: Good example - This dashboard contains all the information a new team member would need to get started
The dashboard should contain:
- Who the Product Owner is and who the Scrum Master is
- The Definition of Ready and the Definition of Done
- When the daily standups occur and when the next Sprint Review is scheduled
- The current Sprint backlog
- Show the current build status
- Show links to:
- Staging environment
- Production environment
- Any other external service used by the project e.g. Octopus Deploy, Application Insights, RayGun, Elmah, Slack
Your solution should also contain the standard _Instructions.docx file for additional details on getting the project up and running in Visual Studio.
For particularly large and complex projects, you can use an induction tool like SugarLearning to create a course for getting up to speed with the project.
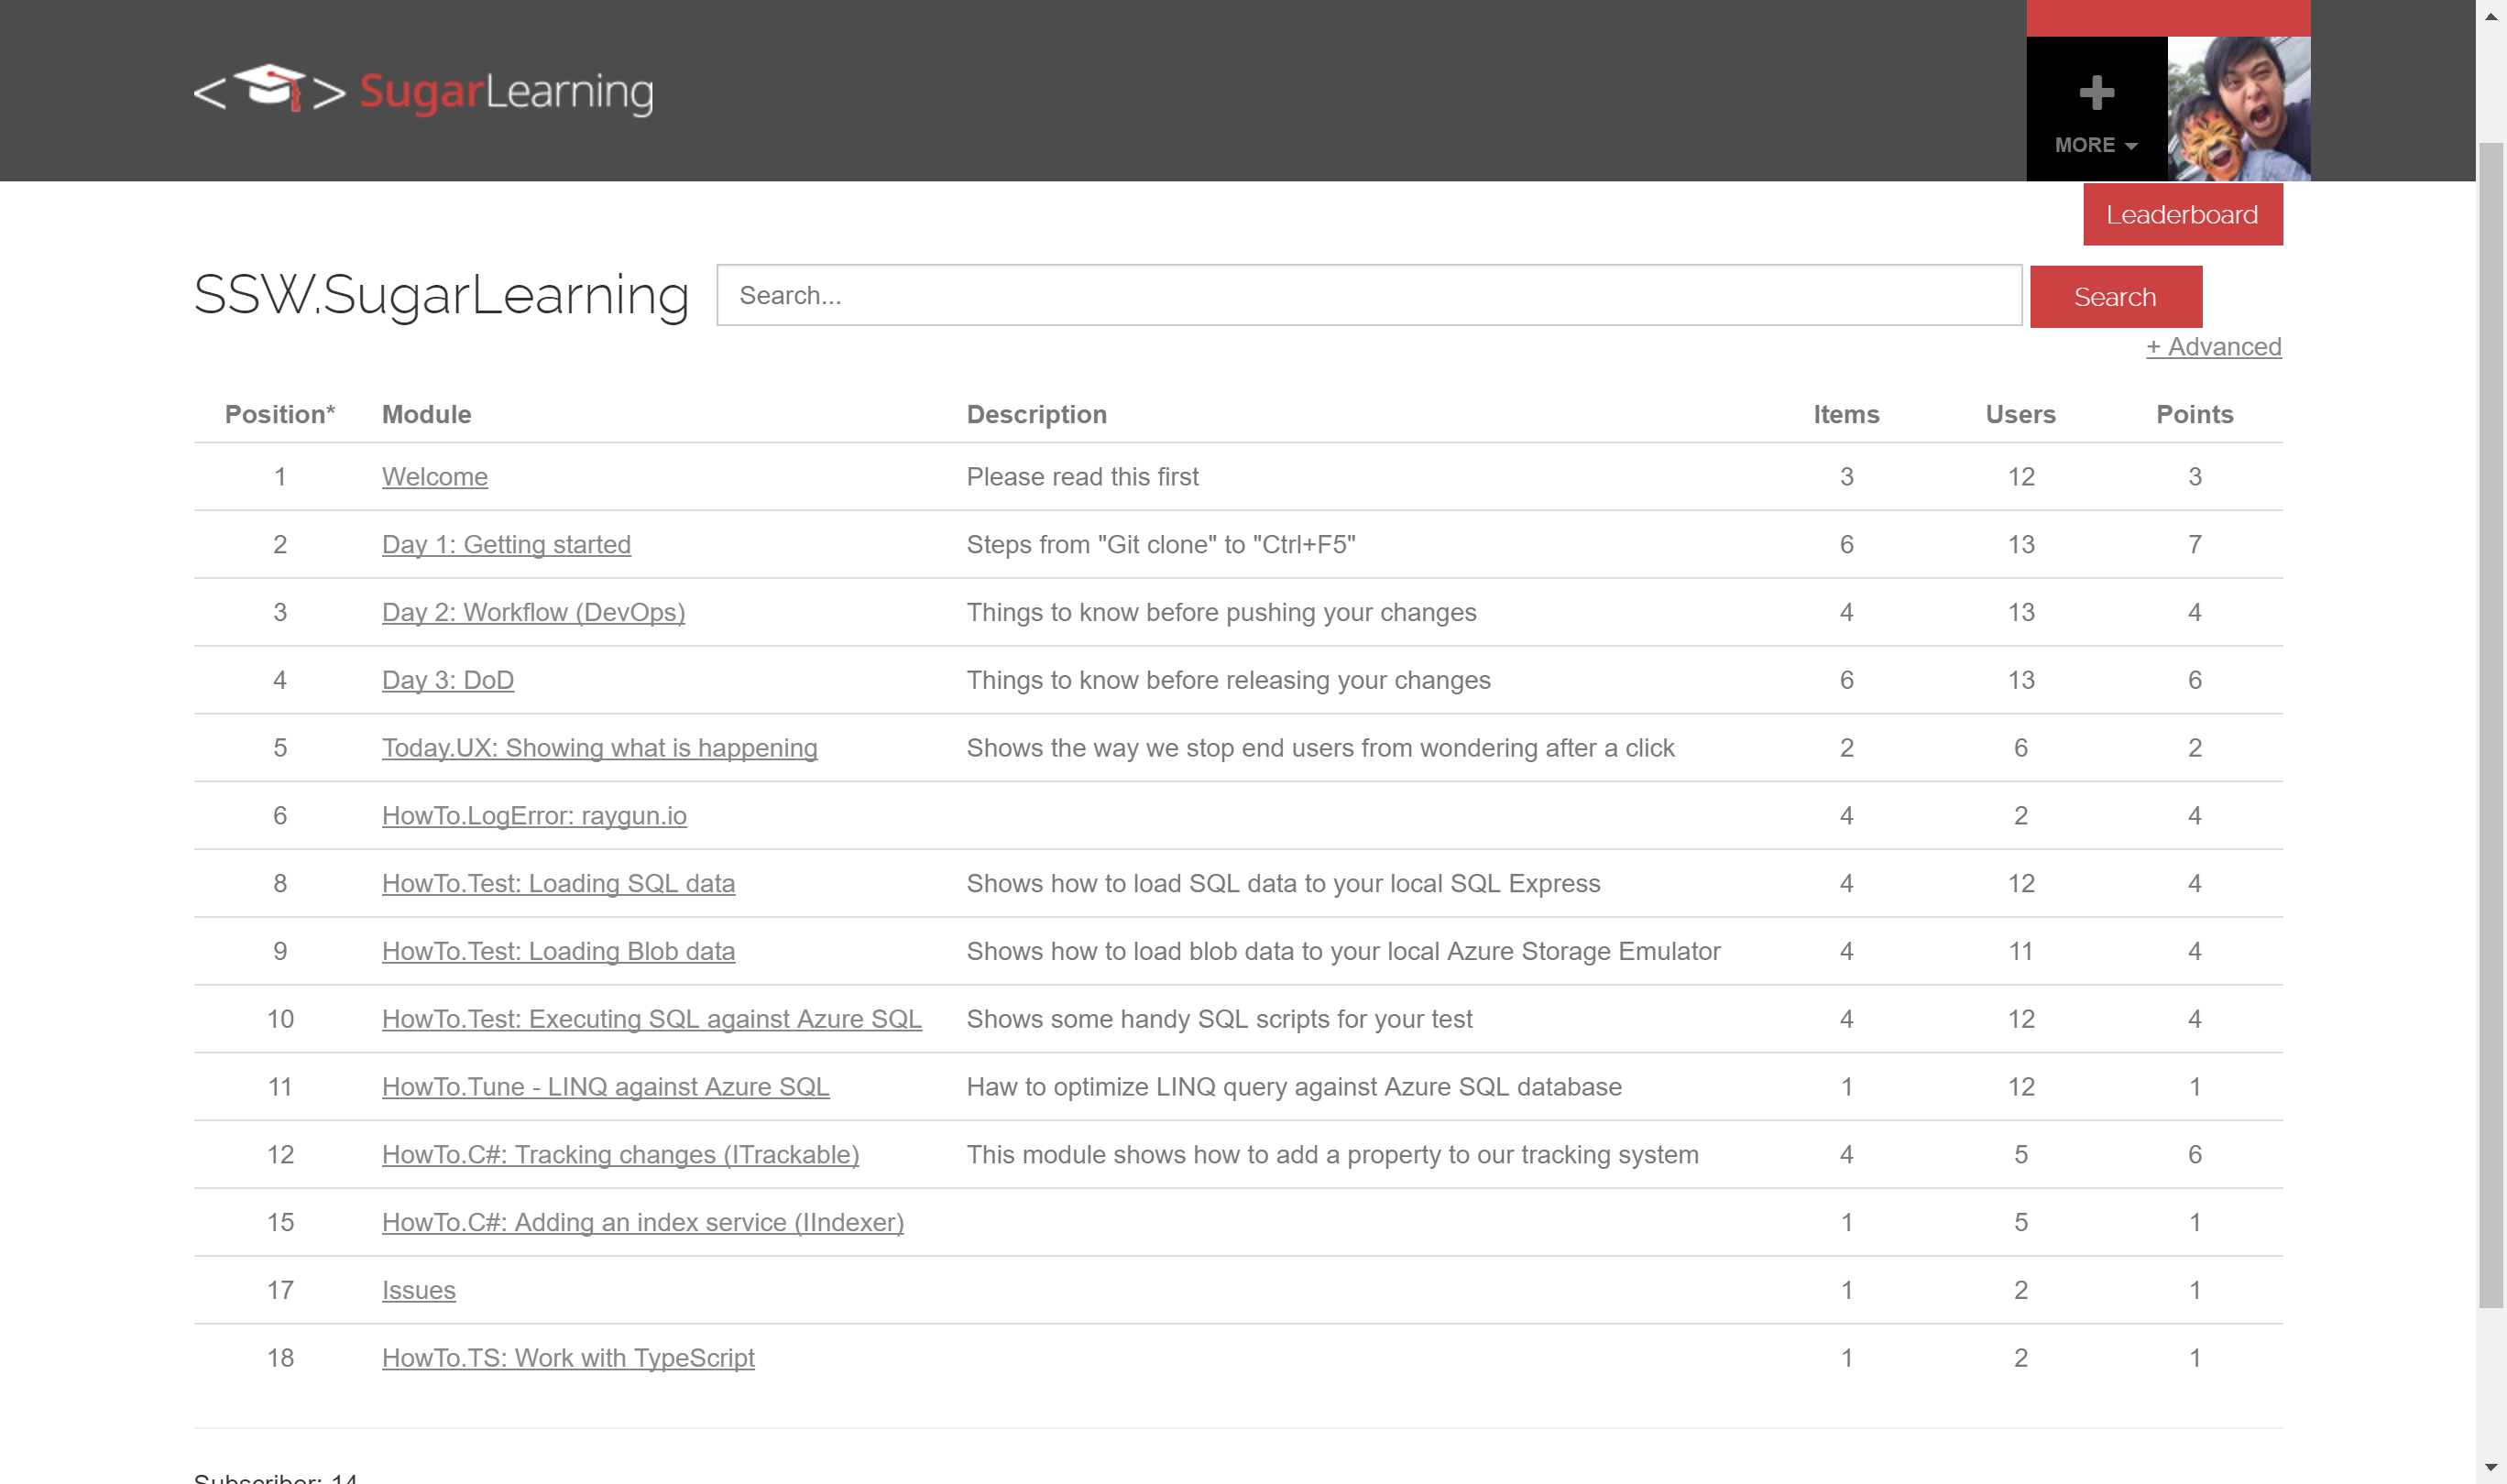
Figure: SugarLearning induction tool
Do you Continuously Deploy?
Continuous deployment is a set of processes and systems in place where every change is proven to be deployable to production and then deployed to production. E.g. DB migrations, code changes, metadata changes, scripts, etc.
At minimum teams needs to ensure that (a) All changes are sanitized by an automated continuous deployment pipeline (b) changes at end of each Sprint are deployed to production.
View more detailed rules at Rules to Better Continuous Deployment with TFS
Do you use the best deployment tool?
Often, deployment is either done manually or as part of the build process. But deployment is a completely different step in your lifecycle. It's important that deployment is automated, but done separately from the build process.
There are two main reasons you should separate your deployment from your build process:
- You're not dependent on your servers for your build to succeed. Similarly, if you need to change deployment locations, or add or remove servers, you don't have to edit your build definition and risk breaking your build.
- You want to make sure you're deploying the *same* (tested) build of your software to each environment. If your deployment step is part of your build step, you may be rebuilding each time you deploy to a new environment.
The best tool for deployments is Octopus Deploy.
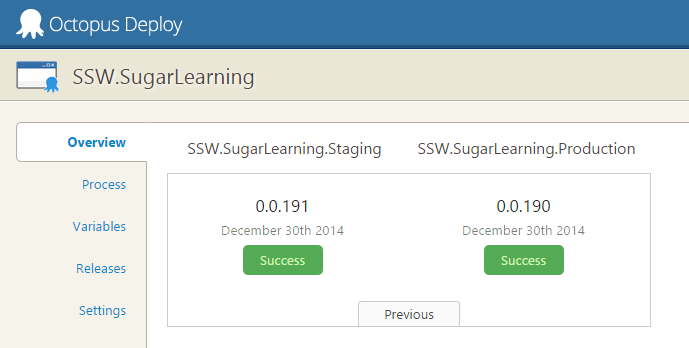
✅ Figure: Good Example - SSW uses Octopus Deploy to deploy Sugar Learning
Octopus Deploy allows you to package your projects in Nuget packages, publish them to the Octopus server, and deploy the package to your configured environments. Advanced users can also perform other tasks as part of a deployment like running integration and smoke tests, or notifying third-party services of a successful deployment.
Version 2.6 of Octopus Deploy introduced the ability to create a new release and trigger a deployment when a new package is pushed to the Octopus server. Combined with Octopack, this makes continuous integration very easy from Team Foundation Server.
What if you need to sync files manually?
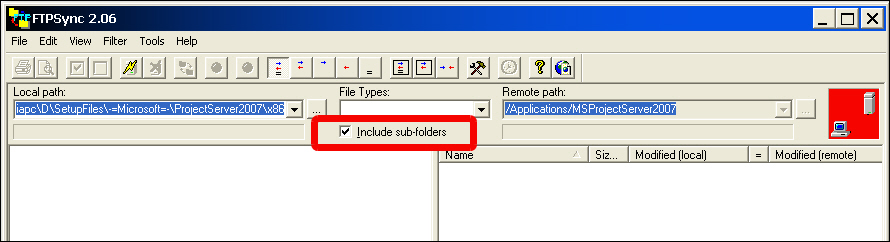
Then you should use an FTP client, which allows you to update files you have changed. FTP Sync and Beyond Compare are recommended as they compare all the files on the web server to a directory on a local machine, including date updated, file size and report which file is newer and what files will be overridden by uploading or downloading. you should only make changes on the local machine, so we can always upload files from the local machine to the web server.
This process allows you to keep a local copy of your live website on your machine - a great backup as a side effect.
Whenever you make changes on the website, as soon as they are approved they will be uploaded. You should tick the box that says "sync sub-folders", but when you click sync be careful to check any files that may be marked for a reverse sync. You should reverse the direction on these files. For most general editing tasks, changes should be uploaded as soon as they are done. Don't leave it until the end of the day. You won't be able to remember what pages you've changed. And when you upload a file, you should sync EVERY file in that directory. It's highly likely that un-synced files have been changed by someone, and forgotten to be uploaded. And make sure that deleted folders in the local server are deleted in the remote server.
If you are working on some files that you do not want to sync then put a _DoNotSyncFilesInThisFolder_XX.txt file in the folder. (Replace XX with your initials.) So if you see files that are to be synced (and you don't see this file) then find out who did it and tell them to sync. The reason you have this TXT file is so that people don't keep telling the web
NOTE: Immediately before deployment of an ASP.NET application with FTP Sync, you should ensure that the application compiles - otherwise it will not work correctly on the destination server (even though it still works on the development server).
Do you know that gated checkins mask dysfunction?
Gated checkins are used to stop developers from checking in bad code and breaking the build.
This does not contribute to high functioning teams, and instead masks, or even creates dysfunction.
In the Retro the team decides to turn gated checkins on because Jonny and Sue keep breaking the build.
The build doesn’t get broken any more, because Jonny and Sue now have to fix their code before they check it in.
This doesn’t mean that Jonny and Sue are writing better code, it just means that they are not checking in code that breaks the build.
Gated checkins will not improve their skill level, change their attitude or improve the quality of their code.
The development ninjas on the team are proud of their code, and check in several times per day. Because the gated checkin takes 10 minutes their workflow is impacted.
They resent Jonny and Sue for having to work this way.
Gated Checkins mask the dysfunction on the team, and introduce impediments to the high performers.
❌ Figure: Bad example – Gated Checkins mask dysfunction
In the Retro the team discusses the fact that the build is often broken.
After a round table discussion about becoming better programmers and building better quality software, the team decides to the following guidelines:
- The team will all run build notifications so that everyone knows when, and by whom the build is broken.
- If someone needs help with solving a problem, they are going to feel good about asking for help early, and learning something new in the answer.
- If someone is asked for help, they will gladly share their knowledge to ensure that the quality of the project is maintained ,and the team help each other to become better developers.
- Before checking in, the devs will compile and run all tests.
- If someone checks in and does break the build, they will call out to all members of the team that the build is broken so that no-one gets latest. They will fix the build IMMEDIATELY, and then call out again when it is fixed. (Some teams have a rule that if you break the build three times you have to shout coffee / lunch).
- The team agrees that you don’t go home if the build isn’t green. If it comes to the end of the day and you are not sure your code will not break the build – do not checkin. Create a shelveset and resolve the issue properly the next day.
If you have checked in, the build is broken, and you cannot fix it before going home, you must email all devs on the team, and the Product Owner with an explanation. 7. The status of the build is reviewed in every Daily Scrum.
✅ Figure: Good example – The whole team should be constantly aware and invested in the status of the build, the quality of the software and in encouraging each other to better developers
Small teams
You may not follow this rule when working on small teams of awesome devs, who write code against tests and checkin frequently.
Instead it is encouraged the process to be:
- Checkin 4-5 times a day
- Write lots of tests
- If the tests that you are working against pass- checkin and let the build server do a full compile and run all the tests
- If you have broken the build, call it out, fix it immediately and then call it out again.
This is the most productive way for small teams of awesome developers to produce great code... and it's fun !
Do you know the different ways to version?
There are 2 very common types of software versioning. Knowing when it is appropriate to use each is important.
Simple Versioning
Simple Versioning is using a single incrementing sequence of integers to denote a version. This is an easy versioning scheme to automate, and the most common example of this is to quote the build number as the version. This means any user of the system can quote a version that developers can easily identify when reporting issues.
It can also be done differently but the main idea is to use a meaningful sequence of integers. For example, in Microsoft Office they use the last two numbers of the year and the two numbers of the month (e.g. 2201).
If the Microsoft Office user also wants the hairy details, Microsoft also gives them the less user-friendly build number.
When to use?
Use this on websites and applications, it is generally found in the Help | About area. It is especially great on custom client projects where the whole project is all built together and a build is deployed. This is a quick and easy reference for your users.
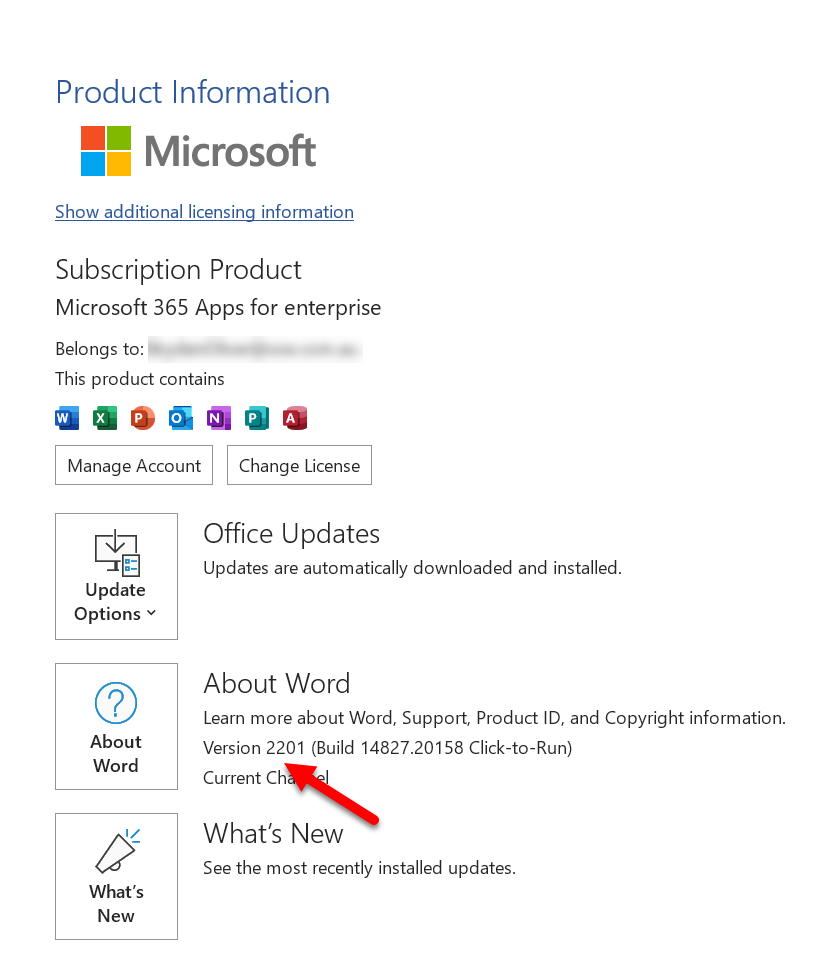
Figure: Microsoft Word uses Simple Versioning
Semantic Versioning
Semantic Versioning has a multi part version (e.g. 2.1.0). Changes in each of the different parts of the version mean different things. This is used to convey information to consumers of the project.
When to use?
Use Semantic Versioning if you are producing libraries or APIs where it's important to easily convey whether a consumer might expect breaking changes. Read more about Semantic Versioning.
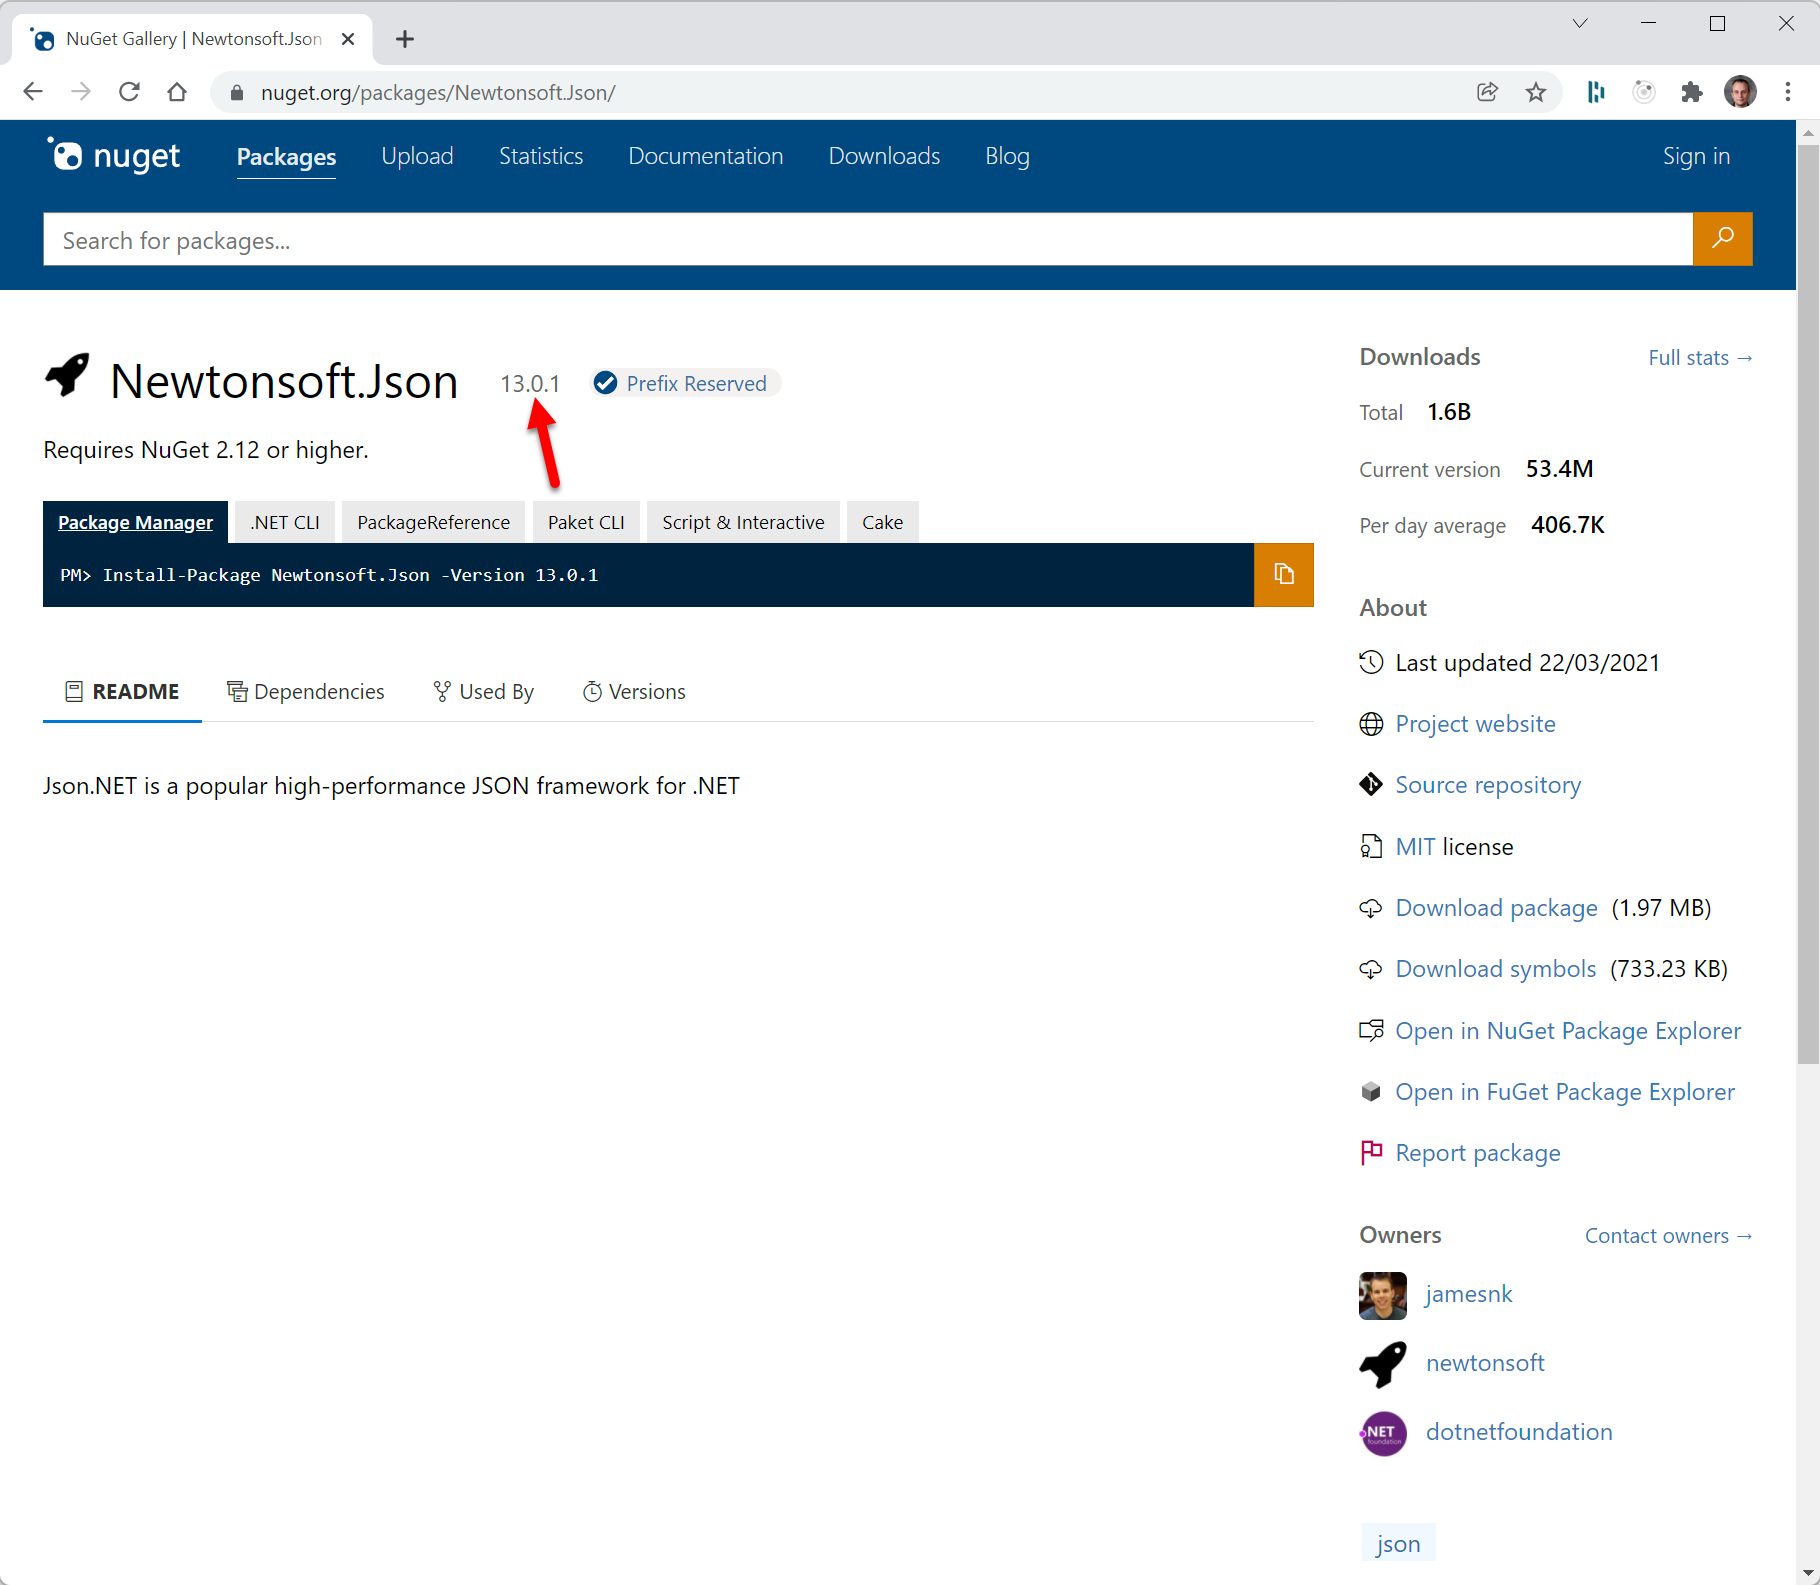
Figure: Nuget packages use Semantic Versioning (as do APIs)
Do you understand the value of Semantic Versioning?
Semantic versioning (sometimes called SemVer) allows library developers to communicate with those who use the library. In the old days, people would choose version numbers on gut feel or they would auto generate them. With Semantic Versioning, the version number conveys the type of changes since the last release and if any changes break backwards compatibility. That way any developer who looks at the version number immediately knows the risk level when they update...
The structure of Semantic Versioning includes:
- A major version e.g. 1.0.0 or 2.0.0
- A minor version e.g. 1.1.0 or 1.2.0
- A patch version e.g. 1.1.1 or 1.1.2
Every release should have a new version, so that when users provide feedback or bug reports, you know the version they were using.
When and how should you increment each version?
Major version ✨🐛
The major version will only be incremented when releasing non-backwards compatible changes (either features or bugs). For example, when something has become obsolete or an interface has changed fundamentally. When the Major version is incremented the minor and patch version both reset to 0.
So 3.4.9 would go to 4.0.0.
Minor version ✨
If a new release includes a new backwards-compatible feature the minor version would be incremented by 1 and the patch version is reset to 0.
So 1.1.6 would go to 1.2.0.
Patch version 🐛
Patches are not for features, they are only for backwards-compatible bug fixes. In that case only the patch version is incremented.
So 2.2.0 would go to 2.2.1.
Pre-release version 😎
A pre-release version is for when you want to put out a major version but first you want to test out a beta version with early adopters. You can create a pre-release version by adding a hyphen and some letters
So a pre-release version might look like 1.0.0-preview1.
Upgrading packages
As developers we are constantly upgrading the packages we depend on whether it be yarn, npm or NuGet. Understanding Semantic Versioning allows us to upgrade more frequently, for example, if a package Semantic Version indicates there are only bug fixes then why wouldn't we update immediately.
The key benefit of Semantic Versioning is that you can be confident about the impact of upgrading to a particular version of a package. So, if you see the third number change, you can be sure it only has bug fixes.
On the other hand, if you see the first number change, you can be sure it will have breaking changes. If you are upgrading to a major version you should check the release notes.
Regardless, of what version you upgrade to, you still need to test your application functions as normal.
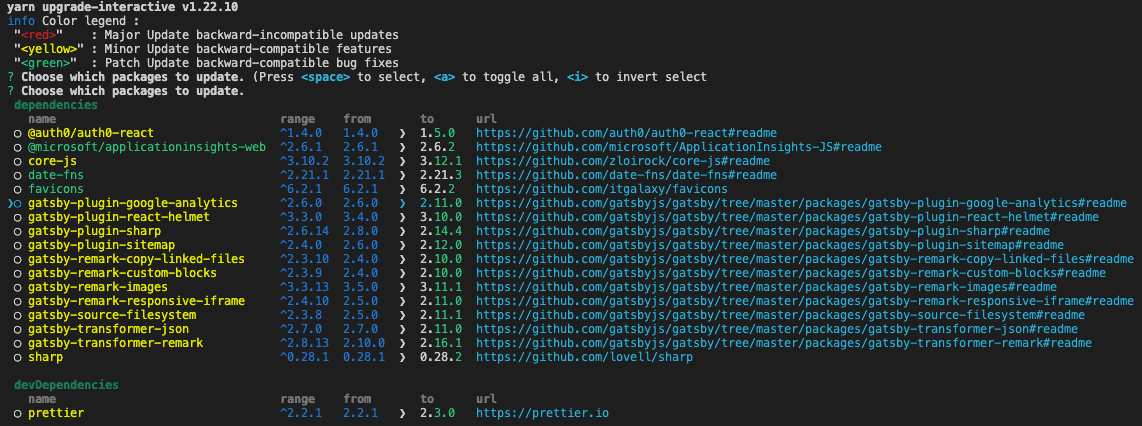
Figure: Good use of Semantic Versioning. Green packages are “patch versions”, yellow packages are “minor versions” and if there were red packages, you would know to beware as they are “major versions” with breaking changes.
Additional resources
These are some awesome resources for learning more about Semantic Versioning:
Video: The ever dapper and handsome Donovan Brown's talk on Semantic VersioningDo you know how to name your CI workflows?
When working with Continuous Integration (CI) workflows like a GitHub Action or Azure DevOps Pipline, a poorly named file can lead to confusion and slow down the development process. Imagine having to dig into the code to understand what a workflow does every time you encounter it. It's like trying to read a book without a title or chapter names!
A well-named workflow file can save time and reduce confusion. By following a clear naming convention that reflects the purpose and sequence of the workflow, you can understand what's happening at a glance.
Naming your workflows in a way that reflects their purpose and sequence will improve developers experience. Stick to a clear and descriptive naming convention, and you'll never have to guess what a workflow does again.
ssw-rulesgpt-prod.yml
❌ Figure: Bad Example - It's unclear what the workflow does, the name doesn't reflect the sequence of actions.
main-build-deploy.yml
✅ Figure: Bad Example - It's clear that changes to the main branch cause a build and deploy.
It's easy to understand, even for someone new to the project.
Steps to naming a workflow:
- Start with the trigger: What triggers the workflow? (e.g., main, pr)
- Describe the main action: What's the primary task? (e.g., build, lint)
- Include additional details: Any secondary actions or specific details? (e.g., and-deploy, infra-check)
Use this template to determine {{TRIGGER}}-{{ACTIONS}}-{{ADDITIONAL DETAILS}}.yml
Do you use enterprise secrets in your DevOps pipelines?
<introEmbed body={<> Managing secrets is hard. It's not just about storing them securely, but also ensuring that the right people and systems have access to them in a controlled manner, with an auditable trail, while minimizing friction for the processes that legitimately need them, like DevOps pipelines. You wouldn't leave your front door key under the mat, but at the same time you don't want it to take 7 minutes and approval from 4 people to unlock your front door. </>} /> In a development ecosystem, secrets are the lifeblood that makes many processes tick smoothly – but they're also a potential point of vulnerability. When multiple repositories and workflows require access to shared secrets, like an Azure Service Principal or credentials for a service account, the management overhead increases. Imagine the pain of secrets expiring or changing: the need to update each and every repository that uses them emerges. Beyond the inconvenience, doing this manually for each repository is not only tedious but fraught with risks. An erroneous secret entry might break a CI/CD pipeline or, even worse, pose a security risk. Let's explore ways to handle secrets more efficiently and securely. ## Scenario: Every time a new repository is set up, developers manually add secrets to it. <figureEmbed figureEmbed={{ preset: "badExample", figure: '<imageEmbed alt="Image" size="large" showBorder={false} figureEmbed={{ preset: "default", figure: \'Secrets added to each repository\', shouldDisplay: true }} src="/uploads/rules/enterprise-secrets-in-pipelines/repo-secrets.png" />', shouldDisplay: true } } /> ### Problems: ❌ High maintenance if secrets need to be changed or rotated.\ ❌ Greater risk of inconsistencies between repos.\ ❌ Increased vulnerability surface area – each repo is a potential leak point. ## Scenario: Instead of per repo, secrets are added at the GitHub organization level. <figureEmbed figureEmbed={{ preset: "okExample", figure: '<imageEmbed alt="Image" size="large" showBorder={false} figureEmbed={{ preset: "default", figure: \'Secrets added to the GitHub organization\', shouldDisplay: true }} src="/uploads/rules/enterprise-secrets-in-pipelines/org-secrets.png" />', shouldDisplay: true } } /> ### Advantages: ✅ Easier management as secrets are centralized.\ ✅ Reduced chances of inconsistencies.\ ✅ Less manual work for individual repos. ❌ Still a concern - While more efficient, secrets still reside within the CI/CD tool and can be exposed if the platform is compromised. ## Scenario: Secrets are stored in Azure Key Vault and accessed by various workflows as needed. ```yaml name: Deploy API on: push: branches: - main jobs: deploy: runs-on: ubuntu-latest steps: # Check out your code - name: Checkout code uses: actions/checkout@v2 # Login to Azure - name: Login to Azure uses: azure/login@v1 with: creds: ${{ secrets.AZURE_CREDENTIALS }} # Note you need this credential in GitHub # Fetch the API key from Azure Key Vault - name: Get API key from Azure Key Vault run: | az keyvault secret show --name SSW_REWARDS_API_KEY --vault-name kv-rewards --query value -o tsv > api_key.txt id: fetch-key # Use the API key in a subsequent step - name: Deploy with API Key run: | API_KEY=$(cat api_key.txt) # Your deployment commands using the API_KEY # (Optional) Logout from Azure - name: Logout from Azure run: az logout ``` <figureEmbed figureEmbed={{ preset: "okExample", figure: 'Listing: Secrets stored in a dedicated Key Vault in Azure and used by workflows across the organization', shouldDisplay: true } } /> ### Advantages: ✅ Stronger security - Azure Key Vault provides enhanced encryption and access control.\ ✅ Centralized management - Rotate, update, or revoke secrets without touching individual repos or workflows.\ ✅ Auditing - Track who accesses what and when. ❌ Still a concern - Dependencies on external systems can introduce complexities and may require specific expertise to manage. ## Scenario: Secrets are stored in an enterprise-grade secrets manager, which integrates directly with CI/CD platforms. <figureEmbed figureEmbed={{ preset: "goodExample", figure: '<imageEmbed alt="Image" size="large" showBorder={false} figureEmbed={{ preset: "default", figure: \'An enterprise password/secrets manager like Keeper with the Secrets Manager add-on and integration with GA or AzDo\', shouldDisplay: true }} src="/uploads/rules/enterprise-secrets-in-pipelines/enterprise-secrets.jpg" />', shouldDisplay: true } } /> <a href="https://vimeo.com/672797748">Watch the video</a> ### Advantages: ✅ **Top-tier Security** - Dedicated systems like Keeper are designed with advanced security features.\ ✅ **Streamlined Management** - Centralize not just CI/CD secrets, but potentially all organizational secrets.\ ✅ **Granular Control** - Control who can access what, with full audit trails.\ ✅ **Integrations** - Seamless integration with CI/CD platforms reduces friction and the potential for errors. ## Conclusion: Leveraging specialized tools reduces manual overhead, boosts security, and ensures a smooth CI/CD process. Note that in all of these cases, you still need at least one secret stored with your pipeline, whether that's a service principal to log in to Azure to retrieve secrets from Key Vault, or Keeper Secrets Configuration (or equivalent) to access your enterprise secrets manager. Note that if you require different permissions for different workflows or repositories, you may end up with as many secrets in your pipeline tool as if you had the target secrets themselves there. This may seem counter-productive, but in most cases this is still a better way to manage your secrets, as you still have enterprise controlled access and governance, and a single source of truth. Remember, the ideal approach may vary based on the size of the organization, the nature of the projects, and specific security requirements. But centralizing and bolstering security around secrets is always a prudent approach.Do you know which environments you need to provision when starting a new project?
Before any project can be used by a customer it must first be published to a production environment. However, in order to provide a robust and uninterrupted service to customers, it is important that the production environment is not used for development or testing purposes. To ensure this, we must setup a separate environment for each of these purposes.
Skipping environments in a feeble attempt to save money will result in untested features breaking production.
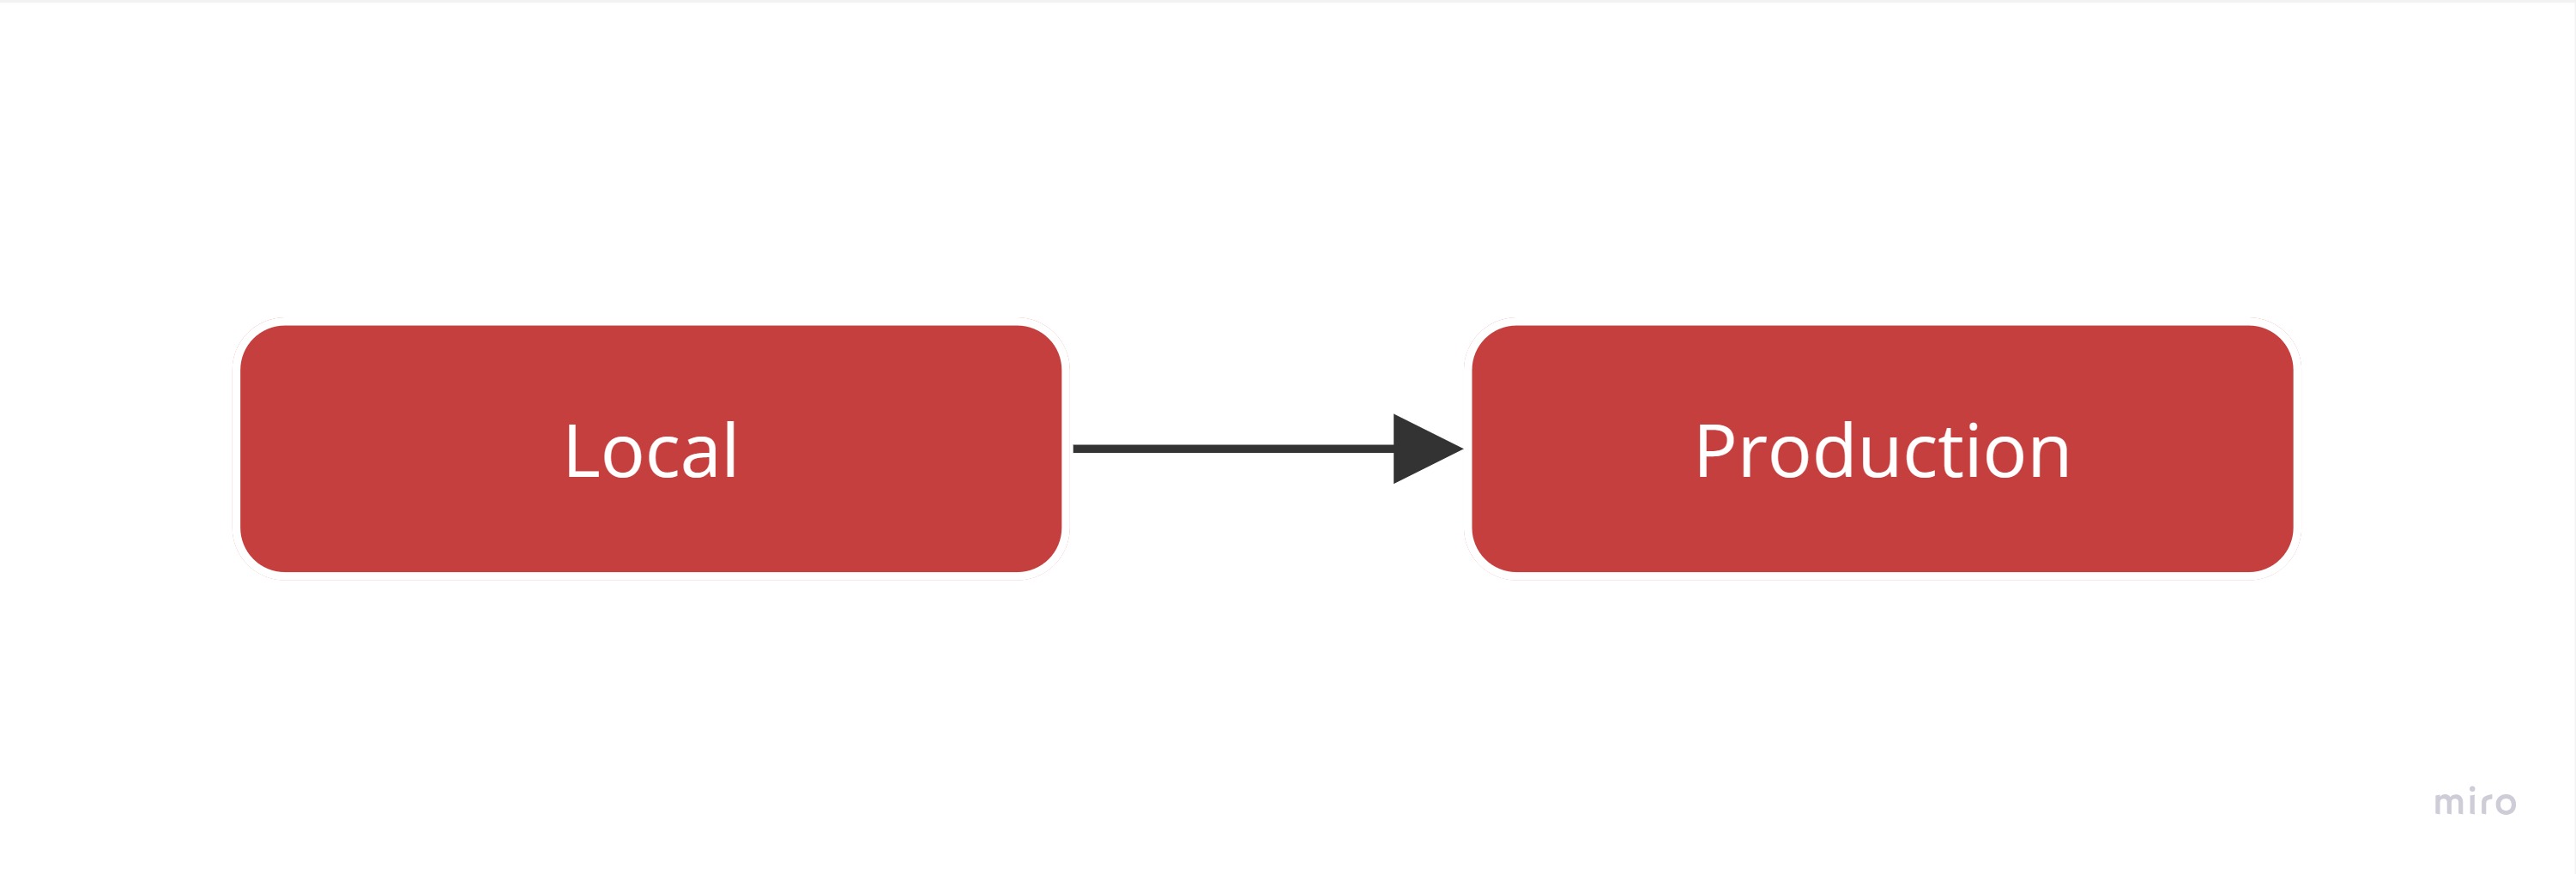
❌ Figure: Bad example - Skipping environments
What is each environment for?
- Production: Real data being used by real customers. This is the baseline/high watermark of all your environments. Lower environments will be lower spec, fewer redundancies, less frequent backups, etc
- Staging: 'Production-like' environment used for final sign-off. Used for testing and verification before deploying to Production. Should be as close to Production as possible e.g. access (avoid giving developers admin rights), same specs as production (especially during performance testing). However, this is not always the case due to cost implications. It is important that staging is 'logically equivalent' to production. This means having the same level of redundancy (e.g. Regions + Zones), back-ups, permissions, and service SLAs
- Development: A place to verify code changes. Typically, simpler or under-specified version of Staging or Production environments aiding in the early identification and troubleshooting of issues (especially integration)
- Ephemeral: Short-lived environment that is spun up on demand for isolated testing of a branch, and then torn down when the branch is merged or deleted. See rule on ephemeral environments
- Local: Developer environment running on their local machine. May be self-contained or include hosted services depending on the project's needs
What environments should I create for a new project?
Internal or small projects
For smaller projects we can often get away without having a dedicated development environment. In this scenario we have 2 hosted environments + 1 local:
- Production
- Staging
- Local
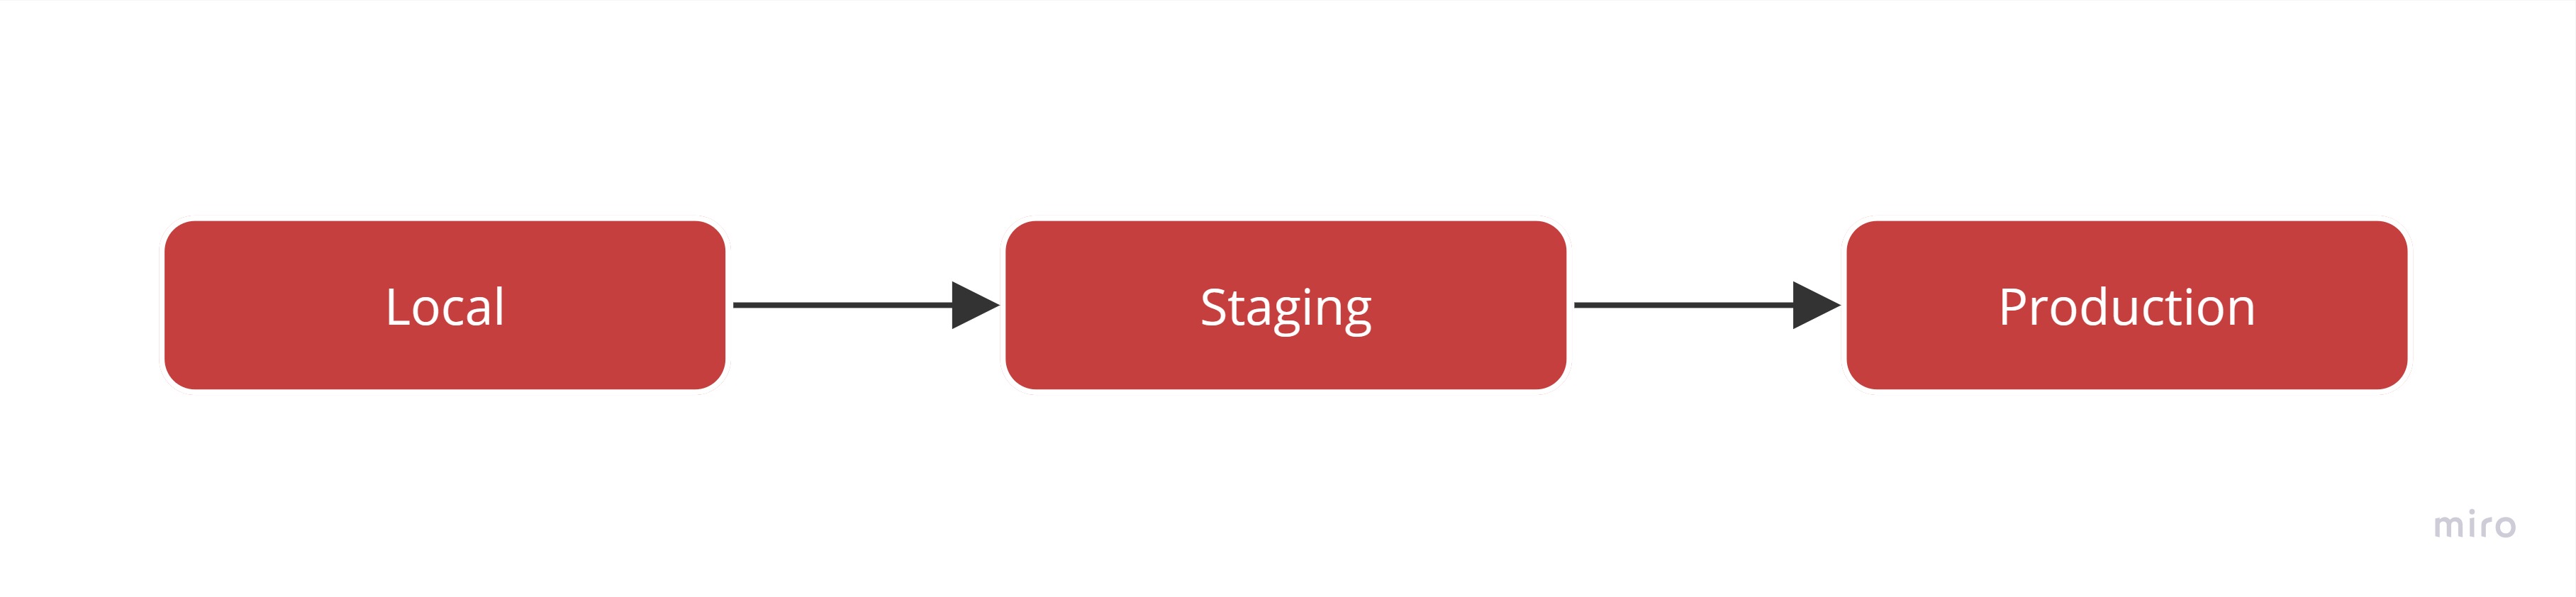
✅ Figure: Good example - Internal or Small Projects have fewer environments
Large or multi-team projects
For large projects it's recommended to run 4 hosted environments + 1 local:
- Production
- Staging
- Development
- Ephemeral (if possible)
- Local
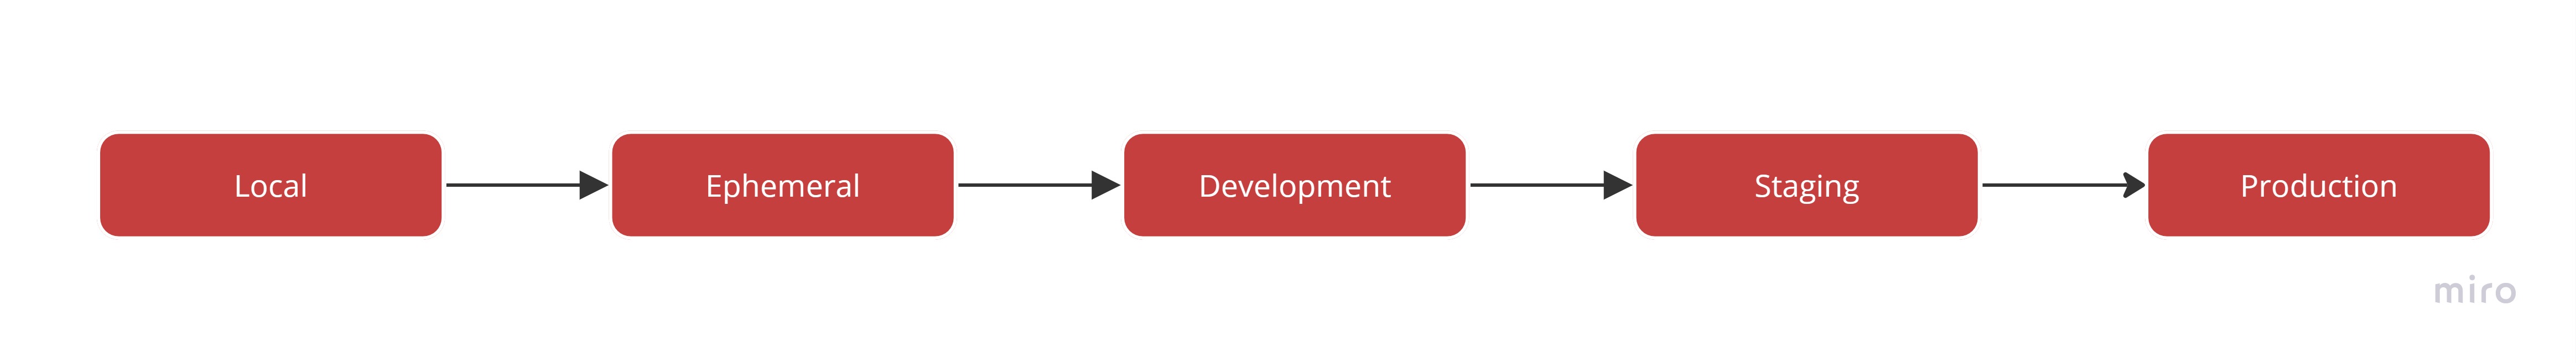
✅ Figure: Good example - Large or Multi-Team Projects tend to have more environments
The above is a general recommendation. Depending on your project's needs you may need to add additional environments e.g. support, training, etc.
Do you follow semver when publishing npm packages?
When publishing an npm package, following Semantic Versioning (semver) is essential. It communicates changes clearly to your users and ensures smooth updates for their projects.
Why use semver in NPM Publishing
Semantic Versioning (semver) helps your users understand the impact of updates and manage their own dependencies more effectively. By adhering to semver, you make it clear whether an update introduces breaking changes, new features, or just bug fixes:
- 💥 MAJOR (Breaking Changes): Signals to users that there are incompatible changes.
- 🚀 MINOR (New Features): Informs users about new features that won’t break existing functionality.
- 🐛 PATCH (Bug Fixes): Indicates that bug fixes or small improvements have been made without changing behavior.
Learn more about semantic versioning.
Common Mistakes to Avoid ⚠️
❌ Incorrect Versioning
Ensure you understand the type of changes you’re making. For example, if you introduce breaking changes but incorrectly release it as a patch update (e.g., from
1.0.0to1.0.1), it can cause significant issues for users relying on version ranges like^1.0.0or~1.0.0in theirpackage.json.These ranges automatically pull in updates for compatible versions. By incorrectly marking a breaking change as a patch, you risk breaking their projects without warning. Always increment the MAJOR version for breaking changes to ensure users can consciously decide when to adopt them.
To better understand what the
^,~, and other symbols mean in npm versioning, check out What do the different symbols mean for npm version?.❌ Forgetting to Communicate Breaking Changes
For major updates, clearly communicate the breaking changes in your release notes or changelog. This helps users prepare for or adapt to the changes.
✅ Figure: Good example - Tell public about the major release update and breaking changes
Tools to Help You Follow semver
- 📝 changesets A tool designed to manage versioning, changelogs, and release workflows in a more structured way. It helps you track changes in your codebase with "changeset" files that describe the changes made and their version impact, ensuring consistent versioning and changelog generation.
- 🤖 Semantic Release An automated tool that helps you manage versioning and changelogs based on your commit messages. It ensures that versions are incremented correctly according to your changes.
- 🔄 Standard Version A tool for automating versioning and changelog generation based on conventional commit messages. It follows the rules of semver and can help reduce manual errors in version management.
- 📚 Keep a Changelog A standard for writing clear and consistent changelogs. Keeping a changelog is essential for communicating breaking changes and other updates clearly with users.
- 🔢 semver A library that helps parse and compare version numbers. It’s useful for checking if a version change follows the semver rules.
- 📖 Semantic Versioning Specification The official guide for Semantic Versioning. It outlines the full specification and provides more detailed rules that you should follow when working with semver.
Important Semver Rules to Follow ✅
Here are some key rules from the Semantic Versioning Specification that you should keep in mind:
- Version Numbers Must Be Non-Decreasing Version numbers must always increase. If you publish a lower version than the previous one, it will cause issues for users.
- Pre-release Versions and Build Metadata Semver allows for the use of pre-release versions (e.g.,
1.0.0-alpha.1) and build metadata (e.g.,1.0.0+20130313144700). These should be used to indicate versions that are not ready for production or specific builds that don’t affect the versioning rules. - Incrementing Versions
- Patch: Only increment for bug fixes and minor changes that do not affect the API.
- Minor: Increment for new features that do not break backward compatibility.
- Major: Increment for breaking changes to the API or backward incompatibilities.
- API Stability Always ensure that your API is backward compatible unless you are marking it as a breaking change. It’s essential to be mindful of how updates impact users' current implementations.
- Changelogs and Documentation Always document changes thoroughly, particularly breaking changes, in your changelog and version history. This documentation provides context and helps users understand what to expect from each version.
